Data Interpretation Questions for Competitive Exams

Data Interpretation: Data Interpretation Questions are usually asked in  all competitive exams like SSC, SBI, IBPS, RBI, LIC, RRB, AAI, DRDO, ISRO, NTR, FSSAI, CWC, LIC, SSC CGL, Railways and other state government exams. 
Data Interpretation questions require clear observation of charts like pie chart, bar chart, radar chart, line chart, table chart. On this page, we are providing all varieties of Data Interpretation Questions along with previous year Data Interpretation Questions.
Data Interpretation Questions are usually based on basic knowledge of arithmetic & fast calculation which includes good command on multiplication, division, addition, subtraction along with Vedic Math. 

Data Interpretation Questions is a very important section of Quantitative Aptitude. Most of the questions come from Data Interpretation in Quantitative Aptitude section.

Set-1

Study the following graph carefully and answer the given questions:
The line graph shows the number of cars manufactured in six different months in two different companies


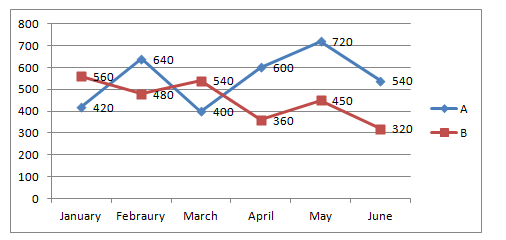
1. What is the ratio of 120% of the number of cars manufactured by company A on January and April together to the 80% of the number of cars sold by company B in march and June together?

Ans:4
Required ratio = 120/100 *(420+600):80/100*(540+320)
=>6*(1020): 4*(860)
=>153:86


2. Number of cars manufactured by company B on March and April together is what percentage more/less than the number of cars manufactured by company A on January and June together?

Ans:1
Required percentage ={(540+360)-(420+540)}/(420+540)*100
=>600/96=6.25%


3. If the number of cars manufactured by company B on July is 120% of the average number of cars manufactured by company A for all the months together (Exclude February and march ), and then find the number of cars manufactured by B on July

Ans:2
Required number of cars = 120/100*(420+600+720+540)/4
=>6/5*2280/4=6/5*570=684


4. What is the difference between the total number of cars manufactured by company A and the total number of cars manufactured by company B?

Ans:5
Required difference = (420+640+400+600+720 +540)-(560+480+540+360+450+320)
=>3320-2710
=>610


5. In which of the following month the difference between the number of cars manufactured by company A and B is maximum?

Ans:4
January = 560-420=140
February =640-480=160
March = 540-400=140
April = 600-360=240
June= 540-320=220


Set-2
Study the following graph carefully and answer the given questions:
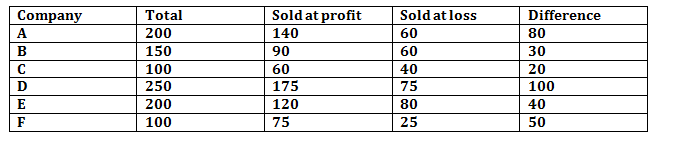
The pie chart shows the percentage distribution of the number of bags sold by six different companies


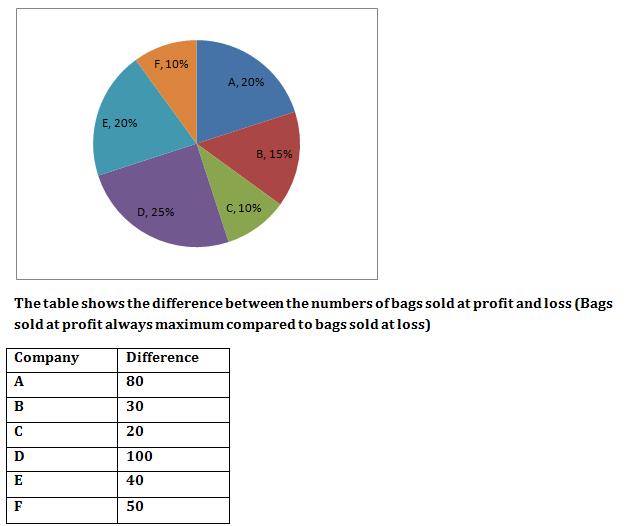
Total difference is 32% of the total number of bags sold by all the companies together

6. Number of bags sold by company B at profit is what percentage more/less than the number of bags sold by company C at loss?

Ans:4
Total number of bags sold = 320/32*100=1000
Company A:
Total bags = 1000*20/100=200
Given,
Let us take bags sold at loss be x
X+x+80=200
=>2x=120=>x=60
Bags sold at profit = 200-60=140
Bags sold at loss = 60
Similarly find all the bags

Required percentage = (90-40)/40*100=>50/40*100
=>250/2=125%


7. What is the ratio of the number of bags sold by company A and C at profit to the number of bags sold by company D and F at loss?

Ans:3
Total number of bags sold = 320/32*100=1000
Company A:
Total bags = 1000*20/100=200
Given,
Let us take bags sold at loss be x
X+x+80=200
=>2x=120=>x=60
Bags sold at profit = 200-60=140
Bags sold at loss = 60
Similarly find all the bags

Required ratio = (140+60): (75+25)=200:100=2:1


8. What is the average number of bags sold by all the companies at profit?

Ans:1
Total number of bags sold = 320/32*100=1000
Company A:
Total bags = 1000*20/100=200
Given,
Let us take bags sold at loss be x
X+x+80=200
=>2x=120=>x=60
Bags sold at profit = 200-60=140
Bags sold at loss = 60
Similarly find all the bags

Required average = (140+90+60+175+120+75)/6
=>660/6=110


9. In which company the number of bags sold at loss is maximum?

Ans:5
Total number of bags sold = 320/32*100=1000
Company A:
Total bags = 1000*20/100=200
Given,
Let us take bags sold at loss be x
X+x+80=200
=>2x=120=>x=60
Bags sold at profit = 200-60=140
Bags sold at loss = 60
Similarly find all the bags

From the table company E sold maximum number of bags at loss


10. Which company sold the bags closest to the average number of bags sold by all the companies together?

Ans:2
Total number of bags sold = 320/32*100=1000

Company A:
Total bags = 1000*20/100=200
Given,
Let us take bags sold at loss be x
X+x+80=200
=>2x=120=>x=60
Bags sold at profit = 200-60=140
Bags sold at loss = 60
Similarly find all the bags

Average number of bags sold by all the companies = 1000/6= 166.67
Company B sold near to the average number of bags sold by all the companies


8 thoughts on “Data Interpretation For Prelims”

  1. Hi there, just became aware of your blog through Google, and found that it is really informative.
    I’m gonna watch out for brussels. I’ll appreciate if
    you continue this in future. Numerous people will be benefited from
    your writing. Cheers! Escape roomy lista

Leave a Comment

Your email address will not be published. Required fields are marked *

Scroll to Top