Data Interpretation Questions for Competitive Exams
Data Interpretation: Data Interpretation Questions are usually asked in all competitive exams like SSC, SBI, IBPS, RBI, LIC, RRB, AAI, DRDO, ISRO, NTR, FSSAI, CWC, LIC, SSC CGL, Railways and other state government exams. Data Interpretation questions require clear observation of charts like pie chart, bar chart, radar chart, line chart, table chart. On this page, we are providing all varieties of Data Interpretation Questions along with previous year Data Interpretation Questions. Data Interpretation Questions are usually based on basic knowledge of arithmetic & fast calculation which includes good command on multiplication, division, addition, subtraction along with Vedic Math. Data Interpretation Questions is a very important section of Quantitative Aptitude. Most of the questions come from Data Interpretation in Quantitative Aptitude section.
Set-35 The following chart represents the marks scored by 5 students in eng, medical and MBA entrance 1. Which of the following is true?
Ans:3 Anu’s avg score =45+50+55/3 =50
2. What is the difference between the total marks obtained by Bindhu and Chandru ?
Ans:2 Marks obtained by Bindhu = 65+50+70 = 185 Marks obtained by chandru = 75+60+55=190 Diff=190-185=5
3. What is the respective ratio of Dolly’s mark in Engg entrance to Bindhu’s mark in Engg entrance?
Ans:1 Dolly’S engg mark :Bindhu’s engg mark 40:65 =8:13
4. Who has scored the highest mark in engineering entrance exams?
Ans:3 On seeing the chart, Chandru has scored the highest mark
5. Who has scored same mark in two entrance exams?
Ans:4 Dolly has scored same marks in both Medical and MBA
Set-36 Profit in lakhs made by 3 companies over the years PROFIT = I-E % P = (I-E/E) * 100
6. Profit made by a company A in the year 2002 was what % of the total profit made by all the 3 companies in same year?
Your email address will not be published. Required fields are marked
gu =
this is rbi
A
Sir data interpretation ke question bhi hindi m dalo
Hi there, just became aware of your blog through Google, and found that it is really informative.
I’m gonna watch out for brussels. I’ll appreciate if
you continue this in future. Numerous people will be benefited from
your writing. Cheers! Escape roomy lista
Very interesting details you have remarked, thank
you for posting.!
Hello there! Do you know if they make any plugins to help with SEO?
I’m trying to get my site to rank for some targeted keywords but
I’m not seeing very good gains. If you know of any please share.
Thank you! I saw similar article here: Bij nl
Howdy! Do you know if they make any plugins to assist with Search Engine Optimization? I’m trying to get my site to rank
for some targeted keywords but I’m not seeing very good success.
If you know of any please share. Cheers! You can read similar text here: Change your life
I’m really impressed together with your writing abilities as smartly as with the layout to your blog. Is that this a paid theme or did you modify it yourself? Anyway keep up the nice quality writing, it’s uncommon to peer a great blog like this one these days. I like gkquestionsguru.com ! It is my: Beehiiv
I’m extremely inspired along with your writing talents and also with the layout on your weblog. Is this a paid topic or did you customize it yourself? Anyway keep up the nice high quality writing, it’s rare to peer a great weblog like this one today. I like gkquestionsguru.com ! Mine is: HeyGen
Explore the ranked best online casinos of 2025. Compare bonuses, game selections, and trustworthiness of top platforms for secure and rewarding gameplayBonus offer.
¡Hola, fanáticos del riesgo !
Casino online extranjero con juegos en vivo sin KYC – https://www.casinoextranjerosespana.es/ п»їcasinos online extranjeros
¡Que disfrutes de asombrosas botes espectaculares!
¡Saludos, estrategas del juego !
Casinos extranjeros para juegos de cartas online – https://www.casinosextranjerosenespana.es/# п»їcasinos online extranjeros
¡Que vivas increíbles jackpots extraordinarios!
¡Saludos, buscadores de tesoros!
Ranking 2025 de casinos online extranjeros top – https://www.casinosextranjerosenespana.es/# casinosextranjerosenespana.es
¡Que vivas increíbles instantes inolvidables !
¡Hola, aficionados a las apuestas!
Casino sin licencia y verificaciГіn simple – http://casinossinlicenciaespana.es/ CasinossinlicenciaEspana.es
¡Que experimentes conquistas extraordinarias !
¡Hola, buscadores de riqueza !
Casino fuera de EspaГ±a confiable y seguro – https://www.casinoonlinefueradeespanol.xyz/ casinoonlinefueradeespanol
¡Que disfrutes de asombrosas momentos memorables !
¡Hola, participantes del desafío !
casino fuera de espaГ±a con opciones flexibles – https://www.casinoonlinefueradeespanol.xyz/ casinos fuera de espaГ±a
¡Que disfrutes de asombrosas premios extraordinarios !
¡Hola, buscadores de fortuna !
Casinossinlicenciaespana.es – Acceso directo – http://casinossinlicenciaespana.es/ casino sin licencia espaГ±a
¡Que experimentes botes sorprendentes!
¡Saludos, cazadores de riquezas !
GuГa para principiantes en casino online extranjero – https://casinoextranjerosenespana.es/# casinoextranjerosenespana.es
¡Que disfrutes de triunfos épicos !
¡Saludos, aventureros del riesgo !
casinosextranjero.es – gana desde el primer giro – https://casinosextranjero.es/# casinosextranjero.es
¡Que vivas increíbles jackpots extraordinarios!
¡Saludos, apostadores apasionados !
Ranking actualizado de casinos extranjeros en 2025 – п»їhttps://casinoextranjerosenespana.es/ casino online extranjero
¡Que disfrutes de oportunidades exclusivas !
¡Saludos, amantes de la diversión !
casino online extranjero con software de calidad – https://casinosextranjero.es/# п»їcasinos online extranjeros
¡Que vivas increíbles recompensas sorprendentes !
¡Hola, usuarios de sitios de apuestas !
casinoextranjero.es – elige el mejor casino por categorГa – https://www.casinoextranjero.es/ mejores casinos online extranjeros
¡Que vivas victorias legendarias !
¡Bienvenidos, fanáticos del azar !
Casino fuera de EspaГ±a para apostadores avanzados – https://www.casinoporfuera.guru/# casino por fuera
¡Que disfrutes de maravillosas premios asombrosos !
Этот обзорный материал предоставляет информационно насыщенные данные, касающиеся актуальных тем. Мы стремимся сделать информацию доступной и структурированной, чтобы читатели могли легко ориентироваться в наших выводах. Познайте новое с нашим обзором!
Подробнее тут – https://nakroklinikatest.ru/
¡Hola, apostadores expertos !
Casino online extranjero con retiros automГЎticos – п»їhttps://casinoextranjero.es/ п»їcasinos online extranjeros
¡Que vivas recompensas fascinantes !
¡Saludos, descubridores de tesoros!
casino por fuera con sistema de puntos – https://casinosonlinefueraespanol.xyz/# casinos online fuera de espaГ±a
¡Que disfrutes de jackpots fascinantes!
¡Saludos, cazadores de suerte !
casino por fuera ideal para nuevos jugadores – https://www.casinosonlinefueraespanol.xyz/# casinosonlinefueraespanol.xyz
¡Que disfrutes de premios espectaculares !
¡Bienvenidos, exploradores de oportunidades !
Acceso directo a casino online fuera de EspaГ±a – https://casinofueraespanol.xyz/# casino por fuera
¡Que vivas increíbles botes deslumbrantes!
¡Hola, amantes del ocio y la emoción !
Top 10 casinos extranjeros con bonos de bienvenida – https://www.casinosextranjerosdeespana.es/# casinos extranjeros
¡Que vivas increíbles jugadas espectaculares !
¡Hola, exploradores del azar !
casinosextranjerosdeespana.es – accede en segundos – https://www.casinosextranjerosdeespana.es/# п»їcasinos online extranjeros
¡Que vivas increíbles jackpots sorprendentes!
¡Hola, estrategas del riesgo !
Casino por fuera con juegos tradicionales y modernos – https://casinosonlinefueradeespanol.xyz/# casinos online fuera de espaГ±a
¡Que disfrutes de asombrosas oportunidades inigualables !
¡Saludos, maestros del juego !
п»їCasinos online extranjeros con pagos rГЎpidos y seguros – https://www.casinoextranjerosdeespana.es/# п»їcasinos online extranjeros
¡Que experimentes maravillosas movidas impresionantes !
¡Saludos, fanáticos del azar !
Casino online extranjero con interfaz en espaГ±ol – https://casinoextranjerosdeespana.es/# mejores casinos online extranjeros
¡Que experimentes maravillosas momentos irrepetibles !
?Hola, cazadores de tesoros !
casino online fuera de EspaГ±a con casino en vivo – п»їhttps://casinosonlinefueradeespanol.xyz/ casinos fuera de espaГ±a
?Que disfrutes de asombrosas tiradas brillantes !
Hello champions of vitality !
Air Purifier to Remove Smoke – Smart Models – п»їhttps://bestairpurifierforcigarettesmoke.guru/ air purifier for smoke
May you experience remarkable unmatched comfort !
¡Hola, exploradores de oportunidades !
Casino sin registro con depГіsitos en criptomonedas – п»їhttps://casinosinlicenciaespana.xyz/ casino online sin licencia espaГ±a
¡Que vivas increíbles giros exitosos !
¡Hola, amantes del ocio y la emoción !
Casinos sin licencia en Espana que permiten jugar anГіnimo – https://casinosinlicenciaespana.xyz/# casino online sin licencia
¡Que vivas increíbles instantes únicos !
¡Bienvenidos, jugadores hábiles !
Casinos sin registro que aceptan Bitcoin – п»їmejores-casinosespana.es Mejores-CasinosEspana.es
¡Que experimentes maravillosas triunfos legendarios !
¡Saludos, maestros del juego !
Casino sin licencia para jugar sin restricciones – п»їaudio-factory.es audio-factory.es
¡Que disfrutes de asombrosas momentos irrepetibles !
¡Saludos, cazadores de recompensas únicas!
Casino sin licencia para usuarios anГіnimos – https://www.audio-factory.es/ casino sin licencia espaГ±ola
¡Que disfrutes de asombrosas momentos irrepetibles !
¡Bienvenidos, buscadores de fortuna secreta !
Casino online sin licencia EspaГ±a sin KYC – http://mejores-casinosespana.es/ casino online sin registro
¡Que experimentes maravillosas momentos inolvidables !
¡Saludos, seguidores de la adrenalina !
Casino sin licencia EspaГ±a sin intervenciГіn externa – https://emausong.es/ casino online sin licencia
¡Que disfrutes de increíbles victorias épicas !
¡Saludos, exploradores de posibilidades únicas !
Casinos con bono de bienvenida al instante – http://bono.sindepositoespana.guru/# casino online con bono de bienvenida
¡Que disfrutes de asombrosas momentos irrepetibles !
Greetings, discoverers of secret humor !
Joke of the day for adults – keep smiling – http://jokesforadults.guru/# best jokes adult
May you enjoy incredible unique witticisms !
¡Saludos, estrategas del juego !
Casino bono de bienvenida sin tarjeta bancaria – https://bono.sindepositoespana.guru/ casino regalo bienvenida
¡Que disfrutes de asombrosas botes sorprendentes!
Greetings, lovers of jokes and good humor !
Funny adult jokes to send your best friend – п»їhttps://jokesforadults.guru/ 1,000 dirty jokes in english
May you enjoy incredible side-splitting jokes !
Hello initiators of serene environments !
Smokers who live with others often rely on the best air purifier for smokers to minimize exposure. It’s especially effective in homes with children or elderly residents. The best air purifier for smokers reduces the risks of secondhand smoke.
A dedicated smoke purifier is crucial for rooms where smoking occurs regularly. It prevents the spread of harmful pollutants. air purifier for smoke Keeping these spaces fresh enhances comfort and health.
Air filter for smoke with quick purification – п»їhttps://www.youtube.com/watch?v=fJrxQEd44JM
May you delight in extraordinary exceptional cleanness !
¿Hola seguidores del juego ?
Los bonos sin rollover son comunes en casas de apuestas fuera de EspaГ±a, lo que permite retirar sin cumplir requisitos abusivos.apuestas fuera de espaГ±aEso convierte la experiencia en algo mГЎs rentable desde el inicio.
Algunas casas de apuestas extranjeras ofrecen acceso anticipado a nuevas slots o versiones beta. Esto te permite jugar antes que en plataformas tradicionales. Y muchas veces, sin necesidad de depГіsito inicial.
Apuestas fuera de espaГ±a: plataformas recomendadas para jugadores – п»їhttps://casasdeapuestasfueradeespana.guru/
¡Que disfrutes de enormes ventajas !
Greetings to all thrill gamblers !
Bettors who use 1xbetregistrationinnigeria.com can take advantage of combo bet bonuses. Nigerian players also get access to weekly leaderboards. 1xbet registration nigeria All promotions at 1xbetregistrationinnigeria.com are updated regularly.
With 1xbet nigeria registration, users can activate their accounts using a promo code for extra rewards. The registration form is available in English, Hausa, and Yoruba. Local bank options make 1xbet nigeria registration even more convenient.
Verified signups through 1xbet ng registration form – п»їhttps://1xbetregistrationinnigeria.com/
Hope you enjoy amazing rounds !
Kind regards to all excitement fans !
The “One-Click Bet” feature is available on 1xbet-login-nigeria.com for the fastest possible gameplay. Activate it to place bets with a pre-set amount with a single click. https://1xbet-login-nigeria.com/ This is especially useful for real-time betting.
The 1xbet nigeria registration online process is protected by an SSL protocol, which guarantees the confidentiality of your data. All the information you provide is securely encrypted. Your security is the company’s top priority.
1xbet ng login registration online | Mobile Entry – п»їhttps://1xbet-login-nigeria.com/
Wishing you incredible turns !
?Mis calidos augurios para todos los adoradores de la emocion !
Los mejores casinos online ofrecen soporte en mГєltiples idiomas. casino online europeo Un casino online europeo se adapta a jugadores nuevos y experimentados. Los mejores casinos online ofrecen jackpots progresivos.
El casino europa cuenta con mesas de pГіker y apuestas deportivas. En casinoonlineeuropeo.blogspot.com puedes encontrar comparativas Гєtiles. Un casino online europa estГЎ optimizado para mГіviles.
CГіmo ganar en un euro casino online: trucos y guГas – п»їhttps://casinoonlineeuropeo.blogspot.com/
?Que goces de excepcionales ganancias !
п»їcasinos online europeos
Abnormal this put up is totaly unrelated to what I was searching google for, but it surely used to be listed at the first page. I suppose your doing one thing proper if Google likes you adequate to place you at the first page of a non similar search.
Im impressed. I dont think Ive met anyone who knows as much about this subject as you do. Youre truly well informed and very intelligent. You wrote something that people could understand and made the subject intriguing for everyone. Really, great blog youve got here.
I think that may be an interesting element, it made me assume a bit. Thanks for sparking my considering cap. On occasion I get so much in a rut that I simply really feel like a record.
It’s the best time to make some plans for the future and it is time to be happy. I’ve read this post and if I could I wish to suggest you some interesting things or tips. Maybe you can write next articles referring to this article. I wish to read even more things about it!
of course like your web-site however you have to check the spelling on several of your posts. Many of them are rife with spelling problems and I find it very troublesome to tell the reality then again I will surely come back again.
Hi, possibly i’m being a little off topic here, but I was browsing your site and it looks stimulating. I’m writing a blog and trying to make it look neat, but everytime I touch it I mess something up. Did you design the blog yourself?
Surprisingly good post. I really found your primary webpage and additionally wanted to suggest that have essentially enjoyed searching your website blog posts. Whatever the case I’ll always be subscribing to your entire supply and I hope you jot down ever again soon!
Great blog here! Additionally your website rather a lot up very fast! What host are you the usage of? Can I get your associate link for your host? I desire my website loaded up as fast as yours lol
Just came from google to your website have to say thanks.
I loved your idea there, I tell you blogs are so exciting sometimes like looking into people’s private life’s and work. Every new remark wonderful in its own right.
Public policy is key here, and our states need to develop some strategies – – soon.
Wish I’d thought of this. Am in the field, but I procrastinate alot and haven’t written as much as I’d like. Thanks.
You are one talented writer thank you for the post.
Thanks for posting this. Looking for these resources 😀
Saludo cordialmente a todos los apostadores expertos !
Las corredores de apuestas ofrecen a los jugadores espaГ±oles mГЎs libertad que las reguladas. Muchos usuarios eligen corredores de apuestas porque permiten mejores cuotas y mГЎs promociones. AdemГЎs, registrarse en corredores de apuestas suele ser rГЎpido y sencillo.
Las corredores de apuestas ofrecen a los jugadores espaГ±oles mГЎs libertad que las reguladas. Muchos usuarios eligen corredores de apuestas porque permiten mejores cuotas y mГЎs promociones. AdemГЎs, registrarse en corredores de apuestas suele ser rГЎpido y sencillo.
casas de apuestas sin verificacion con promociones y mercados internac – п»їhttps://casasdeapuestasextranjeras.xyz/
Ojala disfrutes de increibles jackpots!
casasdeapuestasextranjeras
Great blog here! Additionally your website rather a lot up very fast! What host are you the usage of? Can I get your associate link for your host? I desire my website loaded up as fast as yours lol
Amazing content on your website.
I discovered your weblog site on google and verify just a few of your early posts. Proceed to maintain up the very good operate. I simply further up your RSS feed to my MSN News Reader.
Tham gia game Luck8 ngay! Cá cược đỉnh cao, nổ thưởng khủng, giao dịch siêu tốc. Nhà cái uy tín, trải nghiệm mãn nhãn cùng ưu đãi siêu hời!
How long does it take you to write an article like this?
I’ve thought about posting something about this before. Good job! Can I use part of your post in my blog?
Saludo cordialmente a todos los exploradores del azar!
Los jugadores pueden aprovechar giros gratis sin depГіsito EspaГ±a para comenzar a jugar sin riesgo. Muchos operadores ofrecen 50 tiradas gratis como parte de su bienvenida. AdemГЎs, en sitios como spins gratis sin depГіsito EspaГ±a encuentras promociones actualizadas cada dГa.
Los jugadores pueden aprovechar spins gratis sin depГіsito EspaГ±a para comenzar a jugar sin riesgo. Muchos operadores ofrecen 50girosgratissindeposito.xyz como parte de su bienvenida. AdemГЎs, en sitios como 50 giros gratis encuentras promociones actualizadas cada dГa.
RegГstrate hoy y recibe casino 50 tiradas gratis fГЎcil – п»їhttps://50girosgratissindeposito.xyz/
Deseo que vivas increibles encuentros !
50 giros gratis
I came across an article that talks about the same thing but even more and when you go deeper.
Great blog here! Also your site loads up very fast! What web host are you using? Can I get your affiliate link to your host? I wish my website loaded up as fast as yours lol
Hey very cool site!! Man .. Beautiful .. Amazing .. I will bookmark your website and take the feeds also…I’m happy to find so many useful information here in the post, we need develop more strategies in this regard, thanks for sharing. . . . . .
HBet – Cổng giải trí trực tuyến hàng đầu, quy tụ hàng ngàn trò chơi cá cược thể thao, casino, slot game và bắn cá đổi thưởng. Giao diện mượt mà, bảo mật tuyệt …
HBet – Cổng giải trí trực tuyến hàng đầu, quy tụ hàng ngàn trò chơi cá cược thể thao, casino, slot game và bắn cá đổi thưởng. Giao diện mượt mà, bảo mật tuyệt …
HBet – Cổng giải trí trực tuyến hàng đầu, quy tụ hàng ngàn trò chơi cá cược thể thao, casino, slot game và bắn cá đổi thưởng. Giao diện mượt mà, bảo mật tuyệt …
HBet – Cổng giải trí trực tuyến hàng đầu, quy tụ hàng ngàn trò chơi cá cược thể thao, casino, slot game và bắn cá đổi thưởng. Giao diện mượt mà, bảo mật tuyệt …
A cool post there mate ! Thank you for posting.
I came across an article that talks about the same thing but even more and when you go deeper.
This is one very informative blog. I like the way you write and I will bookmark your blog to my favorites.
What i discover troublesome is to find a weblog that may capture me for a minute however your blog is different. Bravo.
Transform your interiors with copper effect tiles, the perfect blend of style and durability. Our copper effect bathroom tiles bring spa-like warmth and elegance to wet areas, while the robust copper effect floor tiles add an industrial yet luxurious touch to living spaces. Crafted from premium porcelain, these copper look porcelain tiles capture the rich, oxidised beauty of real metal with all the benefits of easy maintenance, stain resistance, and long-lasting performance. Available in a striking 60×120 copper floor tiles format, they create a seamless, contemporary look with minimal grout lines, making them an ideal choice for modern homes and commercial projects alike.
I have to disagree with most of the comments here, but maybe I’m just a contrarian.
Thanks for posting this. Looking for these resources 😀
You appear to know so much about this, and I see you’re a published author. Thanks
it is a really nice point of view. I usually meet people who rather say what they suppose others want to hear. Good and well written! I will come back to your site for sure!
You have some helpful ideas! Maybe I should consider doing this by myself.
fantastic internet site, I could definitely go to your web page once more…acquired some really nice info.
mm88 là sân chơi cá cược đẳng cấp hàng đầu Châu Á. Sở hữu kho game trực tuyến đa dạng từ: xổ số, casino, thể thao,… Tải App để tham gia trải nghiệm mượt …
mm88 là sân chơi cá cược đẳng cấp hàng đầu Châu Á. Sở hữu kho game trực tuyến đa dạng từ: xổ số, casino, thể thao,… Tải App để tham gia trải nghiệm mượt …
mm88 là sân chơi cá cược đẳng cấp hàng đầu Châu Á. Sở hữu kho game trực tuyến đa dạng từ: xổ số, casino, thể thao,… Tải App để tham gia trải nghiệm mượt …
A wholly agreeable point of view, I think primarily based on my own experience with this that your points are well made, and your analysis on target.
Excellent read, I just passed this onto a colleague who was doing a little research on that. And he actually bought me lunch because I found it for him smile So let me rephrase that.|
Substantially, the post is really the best on this laudable topic. I concur with your conclusions and will eagerly watch forward to your future updates.Just saying thanx will not just be enough, for the wonderful lucidity in your writing.
Pretty impressive article. I just stumbled upon your site and wanted to say that I have really enjoyed reading your opinions. Any way I’ll be coming back and I hope you post again soon.
Oh my goodness! an amazing article. Great work.
These are some of the most important issues we’ll face over the next few decades.
Regards for helping out, superb info.
Thanks a bunch for sharing this with all people you really recognize what you are talking about! Bookmarked. Kindly also seek advice from my web site =). We can have a link alternate contract between us!
Thank you for all the information was very accurate, just wondering if all this is possible.~
This is one very informative blog. I like the way you write and I will bookmark your blog to my favorites.
Only a smiling visitor here to share the love (:, btw outstanding style and design .
What a great article.. i subscribed btw!
I like this weblog very much so much great info .
The clarity in your post is just nice and I can tell you are an expert in the subject matter.
Warm greetings to all the casino players !
The entertainment at casino live never stops and keeps evolving. live casino online Secure transactions are guaranteed at casino live The interaction with other players makes casino live more exciting.
Secure transactions are guaranteed at livecasinogreece. With livecasinogreece, you can play roulette, blackjack, and poker in real time. Professional dealers at livecasinogreece make the experience realistic.
Play and Win at casino live – Real Games Anytime – п»їhttps://livecasinogreece.guru/
I wish you amazing winnings !
ОєО±О¶О№ОЅОї live
This article actually helped me with a report I was doing.
Im impressed. I dont think Ive met anyone who knows as much about this subject as you do. Youre truly well informed and very intelligent. You wrote something that people could understand and made the subject intriguing for everyone. Really, great blog youve got here.
Hi, I just hopped over to your web-site through StumbleUpon. Not somthing I might typically browse, but I liked your views none the less. Thanks for making something worthy of reading through.
I would really like to appreciate the endeavors you cash in on written this article. I’m going for the similar best product from you finding out in the foreseeable future as well. Actually your creative writing abilities has urged me to begin my very own blog now. Genuinely the blogging is distributing its wings rapidly. Your write down is often a fine illustration showing it.
Glad to be one of several visitors on this awful internet site : D.
Spot on with this write-up, I truly believe this website requirements a lot much more consideration. I’ll probably be once more to read much much more, thanks for that info.
If most people wrote about this subject with the eloquence that you just did, I’m sure people would do much more than just read, they act. Great stuff here. Please keep it up.
XOSO66 là nền tảng xổ số trực tuyến quốc tế, ra đời với sứ mệnh mang đến cho người chơi một môi trường giải trí minh bạch, công bằng và hiện đại.
Gemwin game bài đại phú quý cung cấp trải nghiệm giải trí trên Web, Android và iOS. Đăng ký, tải Gem win nhận nhiều ưu đãi khủng.
Thank you for the auspicious writeup.
Howdy I wanted to write a new remark on this page for you to be able to tell you just how much i actually Enjoyed reading this read. I have to run off to work but want to leave ya a simple comment. I saved you So will be returning following work in order to go through more of yer quality posts. Keep up the good work.
Good job for bringing something important to the internet!
Do you offer workshops?
You are good writer. Thank you.
Hey, I simply hopped over to your website by way of StumbleUpon. No longer one thing I’d normally learn, but I preferred your thoughts none the less. Thanks for making one thing worth reading.
Just want to say what a great blog you got here!I’ve been around for quite a lot of time, but finally decided to show my appreciation of your work!
I have been surfing online more than three hours today, yet I never found anything that grabbed my interest as much as this piece.
I just sent this post to a bunch of my friends as I agree with most of what you’re saying here and the way you’ve presented it is awesome.
I have to disagree with most of the comments here, but maybe I’m just a contrarian.
?Warm greetings to all the casino players !
Players looking for exciting offers often choose bonus no deposit because it provides easy access to rewards. Many international platforms highlight no deposit bonus casino greece to attract new members and increase engagement. The popularity of such promotions continues to grow as gamblers search for the best deals in the market.
Players looking for exciting offers often choose no deposit bonus greece because it provides easy access to rewards. Many international platforms highlight nodepositbonusgreece to attract new members and increase engagement. The popularity of such promotions continues to grow as gamblers search for the best deals in the market.
Top no deposit bonus greece deals you should not miss this year – п»їhttps://nodepositbonusgreece.guru/
?I wish you incredible jackpots!
no deposit casino
I am glad to be a visitor of this thoroughgoing web blog ! , regards for this rare information! .
I concur with your conclusions and will eagerly look forward to your future updates. The usefulness and significance is overwhelming and has been invaluable to me!
Thanks for posting this. Looking for these resources 😀
Spot on with this write-up, I actually assume this website needs far more consideration. I will in all probability be once more to learn rather more, thanks for that info.
I really believe you will do well in the future I appreciate everything you have added to my knowledge base.
Hiya, I am really glad I have found this information. Nowadays bloggers publish only about gossip and net stuff and this is actually frustrating.
Of course, what a great site and informative posts, I will add backlink – bookmark this site? Regards, Reader
Dude.. I am not much into reading, but somehow I got to read lots of articles on your blog. Its amazing how interesting it is for me to visit you very often. –
I wrote down your blog in my bookmark. I hope that it somehow did not fall and continues to be a great place for reading texts.
Some truly interesting info , well written and broadly user genial .
Nice blog here! Also your web site loads up very fast! What host are you using? Can I get your affiliate link to your host? I wish my web site loaded up as fast as yours lol
Hello there, just became aware of your blog through Google, and found that it is truly informative. I am going to watch out for brussels. I will appreciate if you continue this in future. Lots of people will be benefited from your writing. Cheers!
Good day! This is my first comment here so I just wanted to give a quick shout out and say I really enjoy reading through your articles. Can you recommend any other blogs/websites/forums that cover the same subjects? Thanks a lot!
Assume you are doing good linking to position you on the first pages of search engines.
Sweet blog! I found it while browsing on Yahoo News. Do you have any tips on how to get listed in Yahoo News? I’ve been trying for a while but I never seem to get there! Thank you
I have been surfing online more than three hours today, yet I never found anything that grabbed my interest as much as this piece.
I enjoy your blog posts, saved to my bookmarks!
Wish I’d thought of this. Am in the field, but I procrastinate alot and haven’t written as much as I’d like. Thanks.
Most often since i look for a blog Document realize that the vast majority of blog pages happen to be amateurish. Not so,We can honestly claim for which you writen is definitely great and then your webpage rock solid.
If you don’t mind, where do you host your weblog? I am looking for a very good web host and your webpage seams to be extremely fast and up most the time…
?Warm greetings to all the roulette companions !
Ethical analyses of crypto-enabled gaming platforms assess potential harms and benefits. betting without identificationThese papers stress harm reduction and informed consent. Academia recommends clear disclosure and robust safeguards.
Policy briefs that reference crypto-enabled gaming platforms discuss mitigation strategies. They outline steps to protect users while enabling research. Balanced policy proposals are preferred by most analysts.
ПѓП„ОїО№П‡О·ОјО±П„О№ОєО· П‡П‰ПЃО№Пѓ П„О±П…П„ОїПЂОїО№О·ПѓО·: legal issues and warnings – п»їhttps://bettingwithoutidentification.xyz/#
?I wish you incredible encounters !
ПѓП„ОїО№П‡О·ОјО±П„О№ОєОµП‚ П‡П‰ПЃО№П‚ П„О±П…П„ОїПЂОїО№О·ПѓО·
Hi, possibly i’m being a little off topic here, but I was browsing your site and it looks stimulating. I’m writing a blog and trying to make it look neat, but everytime I touch it I mess something up. Did you design the blog yourself?
?Warm greetings to all the poker masters !
secure anonymous gaming interfaces are being studied by researchers who examine user privacy practices. This research highlights usability and security trade-offs. Regulators and academics continue to monitor these developments.
Technical reviews of research on gaming privacy analyze how identity data is minimized. These reviews prioritize transparency and security considerations. Stakeholders urge measured oversight rather than blanket assumptions.
ПѓП„ОїО№П‡О·ОјО±П„О№ОєОµПѓ П‡П‰ПЃО№Пѓ П„О±П…П„ОїПЂОїО№О·ПѓО· — overview and risks – п»їhttps://bettingwithoutidentification.xyz/#
?I wish you incredible jackpots!
bettingwithoutidentification.xyz
Thank you a lot for sharing this with all folks you actually recognize what you’re speaking about! Bookmarked. Please additionally visit my site =). We can have a hyperlink trade contract among us!
I like your blog. It sounds every informative.
Hi, do have a e-newsletter? In the event you don’t definately should get on that piece…this web site is pure gold!
A warm greeting to all the treasure seekers !
Sites that feature no deposit bonus casino greece usually combine security, variety, and instant accessibility for users. One of the biggest advantages of choosing no deposit bonus casino greece is that it allows players to test games without initial investment. . Players looking for no deposit bonus casino greece can find exciting opportunities on various platforms that cater to Greek audiences.
Gamers often recommend checking free spins no deposit Greece when comparing bonuses across different casinos in Greece. Many sites now highlight free spins no deposit Greece, giving users more chances to enjoy slots and table games risk-free. Whether you prefer slots or live dealer games, free spins no deposit Greece gives you a way to start playing instantly.
Your Guide to Finding bonus no deposit Safely – п»їhttps://nodepositbonusgreece.xyz/#
May you have the fortune to enjoy incredible jackpots!
no deposit casino
Easily, the post is really the greatest on this laudable topic. I concur with your conclusions and will thirstily look forward to your future updates. Saying thank will not just be sufficient, for the wonderful c lucidity in your writing. I will instantly grab your rss feed to stay privy of any updates. Solid work and much success in your business enterprise!
Its just like you read my thoughts! It’s like reading about my family.
I just added your web site to my blogroll, I hope you would look at doing the same.
Spot on with this write-up, I actually assume this website needs far more consideration. I will in all probability be once more to learn rather more, thanks for that info.
Thank you for all the information was very accurate, just wondering if all this is possible.~
When are you going to post again? You really entertain me!
If you are looking to post free classifieds in India online, we highly recommend Xpdea Classifieds. Xpdea is India’s leading free online ads posting site.
If you are looking to post free classifieds in India online, we highly recommend Xpdea Classifieds. Xpdea is India’s leading free online ads posting site.
Nice post.Very useful info specifically the last part 🙂 Thank you and good luck.
The sketch is tasteful, your authored material stylish.
This blog post is excellent, probably because of how well the subject was developed. I like some of the comments too though I could prefer we all stay on the subject in order add value to the subject!
Does it look like we’re in for a big ride here?
Most often since i look for a blog Document realize that the vast majority of blog pages happen to be amateurish. Not so,We can honestly claim for which you writen is definitely great and then your webpage rock solid.
I appreciate your work, thanks for all the great blog posts.
Im impressed. I dont think Ive met anyone who knows as much about this subject as you do. Youre truly well informed and very intelligent. You wrote something that people could understand and made the subject intriguing for everyone. Really, great blog youve got here.
Great blog right here! You seem to put a significant amount of material on the site rather quickly.
When we look at these issues, we know that they are the key ones for our time.
There most be a solution for this problem, some people think there will be now solutions, but i think there wil be one.
I really love this article.
Hello.This article was extremely interesting, particularly since I was searching for thoughts on this subject last couple of days.
Cheers to every reward chasers !
Players who love Mediterranean style and excitement often choose casinoonlinegreek for its vibrant atmosphere and authentic games. greek casino onlineAt casino greek online, you can explore hundreds of slots, live dealers, and bonuses inspired by Greek culture. This casinoonlinegreek destination combines ancient myths with modern gaming technology, creating an unforgettable experience.
Players who love Mediterranean style and excitement often choose greek online casino for its vibrant atmosphere and authentic games. At casino online greek, you can explore hundreds of slots, live dealers, and bonuses inspired by Greek culture. This greek online casino destination combines ancient myths with modern gaming technology, creating an unforgettable experience.
Join casino greek online and Experience Real Casino Excitement – п»їhttps://casinoonlinegreek.com/
May you have the fortune to enjoy incredible Wishing you thrilling benefits !
Most often since i look for a blog Document realize that the vast majority of blog pages happen to be amateurish. Not so,We can honestly claim for which you writen is definitely great and then your webpage rock solid.
I discovered your weblog site on google and verify just a few of your early posts. Proceed to maintain up the very good operate. I simply further up your RSS feed to my MSN News Reader.
I thought it was going to be some boring old post, but I’m glad I visited. I will post a link to this site on my blog. I am sure my visitors will find that very useful.
Amazing! Your site has quite a few comment posts. How did you get all of these bloggers to look at your site I’m envious! I’m still studying all about posting articles on the net. I’m going to view pages on your website to get a better understanding how to attract more people. Thank you!
The clarity in your post is just nice and I can tell you are an expert in the subject matter.
There is so much to try to understand
Good post. I study something more difficult on different blogs everyday. It’s going to always be stimulating to learn content material from other writers and observe a little bit one thing from their store. I’d prefer to use some with the content material on my blog whether you don’t mind. Natually I’ll give you a link in your web blog. Thanks for sharing.
VIPWin nhà cái cá cược trực tuyến top 1 Châu Á, nơi cung cấp kho game đa dạng với tỷ lệ cược hấp dẫn, dịch vụ khách hàng tận tâm.
Γεια χαρά σε όλους! Εδώ είμαστε πάλι, η ομάδα των ειδικών, για να βουτήξουμε σε ένα θέμα που καίει πολλούς παίκτες στην Ελλάδα: ποιές ξένες στοιχηματικές εταιρίες δέχονται τους παίκτες από την χώρα μας ελεύθερα, χωρίς VPN και γρήγορες πληρωμές; Έχουμε περάσει ώρες ατελείωτες δοκιμάζοντας διάφορες πλατφόρμες τζόγου, διαβάζοντας ψιλά γράμματα και μιλώντας με ομάδα υποστήριξης, για να σας δώσουμε την ξεκάθαρη εικόνα για το τι παίζει σε αυτές τις πλατφόρμες πραγματικά.
Τα online καζίνο αποτελούν σήμερα μια από τις πιο δημοφιλείς μορφές ψυχαγωγίας στην Ελλάδα. Η αγάπη των Ελλήνων παικτών για αυτή τη μορφή διασκέδασης μεγαλώνει συνεχώς, και μαζί με αυτή την αύξηση, πολλαπλασιάζονται και οι επιλογές σε διαδικτυακά καζίνο. Αν θέλεις να βρεις τα καλύτερα και πιο ασφαλή καζίνο για να παίξεις, είναι σημαντικό να ξέρεις πώς να ξεχωρίζεις τις αξιόπιστες πλατφόρμες από τις υπόλοιπες. Στο παρακάτω άρθρο θα βρεις χρήσιμες πληροφορίες και συμβουλές για να κάνεις την καλύτερη επιλογή και να απολαύσεις το παιχνίδι με ασφάλεια και διασκέδαση.
Τα online καζίνο αποτελούν σήμερα μια από τις πιο δημοφιλείς μορφές ψυχαγωγίας στην Ελλάδα. Η αγάπη των Ελλήνων παικτών για αυτή τη μορφή διασκέδασης μεγαλώνει συνεχώς, και μαζί με αυτή την αύξηση, πολλαπλασιάζονται και οι επιλογές σε διαδικτυακά καζίνο. Αν θέλεις να βρεις τα καλύτερα και πιο ασφαλή καζίνο για να παίξεις, είναι σημαντικό να ξέρεις πώς να ξεχωρίζεις τις αξιόπιστες πλατφόρμες από τις υπόλοιπες. Στο παρακάτω άρθρο θα βρεις χρήσιμες πληροφορίες και συμβουλές για να κάνεις την καλύτερη επιλογή και να απολαύσεις το παιχνίδι με ασφάλεια και διασκέδαση.
Τα online καζίνο αποτελούν σήμερα μια από τις πιο δημοφιλείς μορφές ψυχαγωγίας στην Ελλάδα. Η αγάπη των Ελλήνων παικτών για αυτή τη μορφή διασκέδασης μεγαλώνει συνεχώς, και μαζί με αυτή την αύξηση, πολλαπλασιάζονται και οι επιλογές σε διαδικτυακά καζίνο. Αν θέλεις να βρεις τα καλύτερα και πιο ασφαλή καζίνο για να παίξεις, είναι σημαντικό να ξέρεις πώς να ξεχωρίζεις τις αξιόπιστες πλατφόρμες από τις υπόλοιπες. Στο παρακάτω άρθρο θα βρεις χρήσιμες πληροφορίες και συμβουλές για να κάνεις την καλύτερη επιλογή και να απολαύσεις το παιχνίδι με ασφάλεια και διασκέδαση.
Γεια χαρά σε όλους! Εδώ είμαστε πάλι, η ομάδα των ειδικών, για να βουτήξουμε σε ένα θέμα που καίει πολλούς παίκτες στην Ελλάδα: ποιές ξένες στοιχηματικές εταιρίες δέχονται τους παίκτες από την χώρα μας ελεύθερα, χωρίς VPN και γρήγορες πληρωμές; Έχουμε περάσει ώρες ατελείωτες δοκιμάζοντας διάφορες πλατφόρμες τζόγου, διαβάζοντας ψιλά γράμματα και μιλώντας με ομάδα υποστήριξης, για να σας δώσουμε την ξεκάθαρη εικόνα για το τι παίζει σε αυτές τις πλατφόρμες πραγματικά.
Γεια χαρά σε όλους! Εδώ είμαστε πάλι, η ομάδα των ειδικών, για να βουτήξουμε σε ένα θέμα που καίει πολλούς παίκτες στην Ελλάδα: ποιές ξένες στοιχηματικές εταιρίες δέχονται τους παίκτες από την χώρα μας ελεύθερα, χωρίς VPN και γρήγορες πληρωμές; Έχουμε περάσει ώρες ατελείωτες δοκιμάζοντας διάφορες πλατφόρμες τζόγου, διαβάζοντας ψιλά γράμματα και μιλώντας με ομάδα υποστήριξης, για να σας δώσουμε την ξεκάθαρη εικόνα για το τι παίζει σε αυτές τις πλατφόρμες πραγματικά.
I do not even know how I ended up here, but I thought this post was good. I do not know who you are but certainly you are going to a famous blogger if you are not already 😉 Cheers!
Advanced reading here!
I like your style!
I don’t know if it’s just me or if everybody else experiencing issues with your site. It appears as though some of the written text on your content are running off the screen. Can someone else please provide feedback and let me know if this is happening to them as well? This could be a problem with my web browser because I’ve had this happen before. Appreciate it
?Calidos saludos a todos los companeros de ruleta !
El reciclaje de dispositivos electrГіnicos debe incluir el borrado de datos. Dejar informaciГіn almacenada puede ser peligroso. casinos sin dni Formatear correctamente es una prГЎctica necesaria.
La ingenierГa social manipula a las personas para obtener informaciГіn. La mejor defensa es la desconfianza ante solicitudes inusuales. Pensar antes de actuar puede evitar un engaГ±o.
Casinos sin DNI con tragamonedas populares – п»їhttps://casinossindni.space/
?Les deseo increibles encuentros !
casinossindni
This blog post is excellent, probably because of how well the subject was developed. I like some of the comments too.
I believe this web site has some really wonderful info for everyone : D.
Thank you a lot for sharing this with all folks you actually recognize what you’re speaking about! Bookmarked. Please additionally visit my site =). We can have a hyperlink trade contract among us!
Fantastic piece of writing here1
While this issue can vexed most people, my thought is that there has to be a middle or common ground that we all can find. I do value that you’ve added pertinent and sound commentary here though. Thank you!
I’ve been surfing online more than 3 hours today, yet I never found any interesting article like yours. It’s pretty worth enough for me. In my view, if all web owners and bloggers made good content as you did, the net will be much more useful than ever before.
A neighbor of mine encouraged me to take a look at your blog site couple weeks ago, given that we both love similar stuff and I will need to say I am quite impressed.
Great post, keep up the good work, I hope you don’t mind but I’ve added on my blog roll.
Thanks , I’ve recently been searching for info about this topic for ages and yours is the best I have discovered so far. But, what concerning the bottom line? Are you certain concerning the source?
I had highly recommend this blog to my good friend, it’s so good
I concur with your conclusions and will eagerly look forward to your future updates. The usefulness and significance is overwhelming and has been invaluable to me!
Great write-up, I am a big believer in placing comments on sites to inform the blog writers know that they’ve added something advantageous to the world wide web!
I cannot thank you more than enough for the blogposts on your website. I know you set a lot of time and energy into these and truly hope you know how deeply I appreciate it. I hope I’ll do a similar thing person sooner or later.
There is perceptibly a lot to identify about this. I consider you made some good points in features also.
WoW decent article. Can I hire you to guest write for my blog? If so send me an email!
Ten ranking prezentuje wyłącznie sprawdzone i legalne kasyna online Polska 2025, które oferują bezpieczną grę, ekskluzywne bonusy i uczciwe warunki. Znajdziesz tu szczegółowe analizy, aby świadomie wybrać najlepszą platformę dla siebie. Poniżej znajdziesz pełne opisy operatorów z naszego rankingu. Wstaw własne grafiki — obrazy wczytują się leniwie i zachowują naturalne proporcje (bez kadrowania).
Ten ranking prezentuje wyłącznie sprawdzone i legalne kasyna online Polska 2025, które oferują bezpieczną grę, ekskluzywne bonusy i uczciwe warunki. Znajdziesz tu szczegółowe analizy, aby świadomie wybrać najlepszą platformę dla siebie. Poniżej znajdziesz pełne opisy operatorów z naszego rankingu. Wstaw własne grafiki — obrazy wczytują się leniwie i zachowują naturalne proporcje (bez kadrowania).
Rynek kasyn online w Polsce charakteryzuje się szybkim wzrostem Młodzi dorośli korzystający z urządzeń mobilnych napędzają wzrost popularności kasyn online oferujących bonus powitalny. Totalizator Sportowy posiada monopol, regulowany na mocy Ustawy o Grach Hazardowych z 2009 roku, a Total Casino jest wiodącą platformą. Konkurencyjny krajobraz obejmuje krajowych i zagranicznych operatorów posiadających licencje z UE. Zaawansowane technologie, takie jak integracja z krupierami na żywo i optymalizacja mobilna, poprawiają doświadczenia użytkowników, podczas gdy wybór kasyna online staje się coraz bardziej złożony inicjatywy odpowiedzialnego hazardu zyskują na znaczeniu. Dowiedz się więcej o dynamice rynku i przyszłych perspektywach.
Rynek kasyn online w Polsce charakteryzuje się szybkim wzrostem Młodzi dorośli korzystający z urządzeń mobilnych napędzają wzrost popularności kasyn online oferujących bonus powitalny. Totalizator Sportowy posiada monopol, regulowany na mocy Ustawy o Grach Hazardowych z 2009 roku, a Total Casino jest wiodącą platformą. Konkurencyjny krajobraz obejmuje krajowych i zagranicznych operatorów posiadających licencje z UE. Zaawansowane technologie, takie jak integracja z krupierami na żywo i optymalizacja mobilna, poprawiają doświadczenia użytkowników, podczas gdy wybór kasyna online staje się coraz bardziej złożony inicjatywy odpowiedzialnego hazardu zyskują na znaczeniu. Dowiedz się więcej o dynamice rynku i przyszłych perspektywach.
However, it is virtually all done with tongues rooted solidly in cheeks, and everyone has absolutely nothing but absolutely love for his or her friendly neighborhood scapegoat. The truth is, he is not just a pushover. He is basically that special variety of person strong enough to take all of that good natured ribbing for exactly what it is.
Thanks For This Blog, was added to my bookmarks.
If most people wrote about this subject with the eloquence that you just did, I’m sure people would do much more than just read, they act. Great stuff here. Please keep it up.
Admiring the time and effort you put into your site and detailed info you offer!
Wow, amazing blog layout! How long have you been blogging for? you made blogging look easy. The overall look of your site is great, as well as the content!
This has to be one of my favorite posts! And on top of thats its also very helpful topic for newbies. thank a lot for the information!
It is perfect time to make some plans for the future and it is time to be happy. I’ve read this post and if I could I want to suggest you some interesting things or suggestions. Perhaps you can write next articles referring to this article. I wish to read more things about it!
There most be a solution for this problem, some people think there will be now solutions, but i think there wil be one.
My brother suggested I might like this web site. He was entirely right. This post actually made my day. You can not imagine simply how much time I had spent for this info! Thanks!
I am glad to be one of the visitors on this great site (:, appreciate it for putting up.
This contained some excellent tips and tools. Great blog publication.
This is really interesting, You’re a very skilled blogger. I have joined your feed and look forward to seeking more of your great post. Also, I’ve shared your web site in my social networks!
I am lucky that I discovered this website , precisely the right info that I was searching for! .
What a great article.. i subscribed btw!
Please let us know when you plan to publish your book!
Excellent article!! I am an avid reader of your website:D keep on posting that good content. and I’ll be a regular visitor for a very long time!!
When are you going to take this to a full book?
Thank you pertaining to sharing the following great subject matter on your website. I ran into it on google. I am going to check to come back after you publish additional aricles.
I have been surfing online more than three hours today, yet I never found anything that grabbed my interest as much as this piece.
If you don’t mind, where do you host your weblog? I am looking for a very good web host and your webpage seams to be extremely fast and up most the time…
Your posts provide a clear, concise description of the issues.
Took me time to read the material, but I truly loved the article. It turned out to be very useful to me.
Your thing regarding creating will be practically nothing in short supply of awesome. This informative article is incredibly useful and contains offered myself a better solution to be able to my own issues. Which can be the specific purpose MY PARTNER AND I has been doing a search online. I am advocating this informative article with a good friend. I know they are going to get the write-up since beneficial as i would. Yet again many thanks.
Hi, I just hopped over to your web-site through StumbleUpon. Not somthing I might typically browse, but I liked your views none the less. Thanks for making something worthy of reading through.
Nice piece of info! May I reference part of this on my blog if I post a backlink to this webpage? Thx.
This contained some excellent tips and tools. Great blog publication.
I encountered your site after doing a search for new contesting using Google, and decided to stick around and read more of your articles. Thanks for posting, I have your site bookmarked now.
88fc là nền tảng cá cược thể thao và casino trực tuyến hàng đầu tại châu Á, mang đến trải nghiệm giải trí an toàn và minh bạch cho người chơi.
fantastic internet site, I could definitely go to your web page once more…acquired some really nice info.
I like what you have to offer. Keep up the good work!
This is something that will need all of our combined efforts to address.
Great resources and tips for families here.
Only a smiling visitor here to share the love (:, btw outstanding style and design .
I am glad to be a visitor of this perfect blog !, appreciate it for this rare info!
Great post. Just a heads up – I am running Ubuntu with the beta of Firefox and the navigation of your blog is kind of broken for me.
Thank you for the auspicious writeup.
Do you offer workshops?
Took me time to read the material, but I truly loved the article. It turned out to be very useful to me.
I’ll check back after you publish more articles.
You are one talented writer thank you for the post.
Woh I enjoy your content , saved to bookmarks!
I would really like to appreciate the endeavors you cash in on written this article. I’m going for the similar best product from you finding out in the foreseeable future as well. Actually your creative writing abilities has urged me to begin my very own blog now. Genuinely the blogging is distributing its wings rapidly. Your write down is often a fine illustration showing it.
of course like your web-site however you have to check the spelling on several of your posts. Many of them are rife with spelling problems and I find it very troublesome to tell the reality then again I will surely come back again.
Well done! Keep up this quality!
Some truly interesting info , well written and broadly user genial .
I don’t know if it’s just me or if everybody else experiencing issues with your site. It appears as though some of the written text on your content are running off the screen. Can someone else please provide feedback and let me know if this is happening to them as well? This could be a problem with my web browser because I’ve had this happen before. Appreciate it
This is the wave – the big wave.
Only a smiling visitor here to share the love (:, btw outstanding style and design .
Just what I needed to know thank you for this.
?Brindemos por cada explorador de tesoros !
Un casino online fuera de espaГ±a publica informes mensuales de RTP real de cada slot. Compara el retorno teГіrico con el rendimiento actual del mes en curso. casino fuera de espaГ±a La transparencia te permite elegir juegos con mejor desempeГ±o reciente.
Un casino online fuera de espaГ±a te permite pausar tu sesiГіn y retomarla desde cualquier dispositivo. Tu progreso se sincroniza automГЎticamente en la nube. La flexibilidad es total.
Casinos fuera de EspaГ±a verifican identidad de forma simple – п»їhttps://casinosonlinefueradeespana.net/
?Que la fortuna te sonria con que vivas increibles victorias inolvidables!
Excellent article!! I am an avid reader of your website:D keep on posting that good content. and I’ll be a regular visitor for a very long time!!
Very Interesting Information! Thank You For Thi Information!
Thanks For This Blog, was added to my bookmarks.
Woh I enjoy your content , saved to bookmarks!
How do I subscribe to your blog? Thanks for your help.
There are some serious financial ramifications here.
Our communities really need to deal with this.
Clear, concise and easy to access.
It’s clear you’re passionate about the issues.
How long does it take you to write an article like this?
Good job for bringing something important to the internet!
I have to disagree with most of the comments here, but maybe I’m just a contrarian.
Some truly interesting info , well written and broadly user genial .
This website has lots of really useful stuff on it. Thanks for informing me.
I really love this article.
This is really interesting, You’re a very skilled blogger. I have joined your feed and look forward to seeking more of your fantastic post. Also, I have shared your website in my social networks!
OK, you outline what is a big issue. But, can’t we develop more answers in the private sector?
You write Formidable articles, keep up good work.
How do I subscribe to your blog? Thanks for your help.
Hello there, just became aware of your blog through Google, and found that it is truly informative. I am going to watch out for brussels. I will appreciate if you continue this in future. Lots of people will be benefited from your writing. Cheers!
This is a great blog. Thank you for the very informative post.
Thanks pertaining to discussing the following superb written content on your site. I ran into it on the search engines. I will check back again if you publish extra aricles.
This is something that will need all of our combined efforts to address.
Are grateful for this blog post, it’s tough to find good information and facts on the internet
There is a lot of misunderstanding about these issues today. Your material helps explain things.
Thank you for sharing this very good post. Very interesting ideas! (as always, btw)
Nice read, I just passed this onto a colleague who was doing some research on that. And he just bought me lunch as I found it for him smile Therefore let me rephrase that: Thank you for lunch!
Great info! Keep post great articles.
you’re in reality a just right webmaster. The web site loading velocity is incredible. It sort of feels that you’re doing any distinctive trick. In addition, The contents are masterpiece. you’ve performed a great process on this topic!
Pretty nice post. I just stumbled upon your weblog and wanted to say that I’ve really enjoyed surfing around your blog posts. After all I’ll be subscribing in your feed and I am hoping you write again very soon!
There are some serious financial ramifications here.
Great blog here! Also your site loads up very fast! What web host are you using? Can I get your affiliate link to your host? I wish my website loaded up as fast as yours lol
Very Interesting Information! Thank You For Thi Information!
It’s the best time to make some plans for the future and it is time to be happy. I’ve read this post and if I could I wish to suggest you some interesting things or tips. Maybe you can write next articles referring to this article. I wish to read even more things about it!
This is definitely a wonderful webpage, thanks a lot..
What a great article.. i subscribed btw!
Admiring the time and effort you put into your site and detailed info you offer!
Nice blog here! Also your web site loads up very fast! What host are you using? Can I get your affiliate link to your host? I wish my web site loaded up as fast as yours lol
I imagine so. Very good stuff, I agree totally.
very good post, i certainly love this web site, keep on it
you’re in reality a just right webmaster. The web site loading velocity is incredible. It sort of feels that you’re doing any distinctive trick. In addition, The contents are masterpiece. you’ve performed a great process on this topic!
These are some of the most important issues we’ll face over the next few decades.
I am glad to be one of the visitors on this great site (:, appreciate it for putting up.
Are the issues really as complex as they seem?
I am glad to be one of the visitors on this great site (:, appreciate it for putting up.
very good post, i certainly love this web site, keep on it
I like what you have to offer. Keep up the good work!
Thanks pertaining to discussing the following superb written content on your site. I ran into it on the search engines. I will check back again if you publish extra aricles.
Hi there, just became aware of your blog through Google, and found that it’s truly informative. It’s important to cover these trends.
Very often I go to see this blog. It very much is pleasant to me. Thanks the author
I found your blog through google and I must say, this is probably one of the best well prepared articles I have come across in a long time. I have bookmarked your site for more posts.
I’ve read several good stuff here. Definitely worth bookmarking for revisiting. I surprise how much effort you put to make such a magnificent informative site.
Great resources and tips for families here.
Public policy is key here, and our states need to develop some strategies – – soon.
Hiya, I am really glad I have found this information. Nowadays bloggers publish only about gossip and net stuff and this is actually frustrating.
Just want to say what a great blog you got here!I’ve been around for quite a lot of time, but finally decided to show my appreciation of your work!
I think that may be an interesting element, it made me assume a bit. Thanks for sparking my considering cap. On occasion I get so much in a rut that I simply really feel like a record.
Unquestionably believe that which you said. Your favorite reason seemed to be on the net the easiest thing to be aware of. I say to you, I certainly get annoyed while people consider worries that they plainly don’t know about. You managed to hit the nail on the head. Will probably be back to get more. Thanks
I dont think Ive caught all the angles of this subject the way youve pointed them out. Youre a true star, a rock star man. Youve got so much to say and know so much about the subject that I think you should just teach a class about it
I’m impressed, I need to say. Really rarely do I encounter a blog that’s both educational and entertaining, and let me tell you, you have hit the nail on the head.
I simply could not leave your site before suggesting that I actually enjoyed the usual info a person supply in your visitors? Is going to be back often to inspect new posts
Your idea is outstanding; the issue is something that not enough persons are speaking intelligently about. I’m very happy that I stumbled throughout this in my seek for one thing regarding this.
I like what you have to offer. Keep up the good work!
Good site! I truly love how it is easy on my eyes it is. I am wondering how I might be notified when a new post has been made. I’ve subscribed to your RSS which may do the trick? Have a great day!
Beneficial Blog! I had been simply just debating that there are plenty of screwy results at this issue you now purely replaced my personal belief. Thank you an excellent write-up.
Greetings, have tried to subscribe to this websites rss feed but I am having a bit of a problem. Can anyone kindly tell me what to do?’
Unquestionably believe that which you said. Your favorite reason seemed to be on the net the easiest thing to be aware of. I say to you, I certainly get annoyed while people consider worries that they plainly don’t know about. You managed to hit the nail on the head. Will probably be back to get more. Thanks
Woh I enjoy your content , saved to bookmarks!
Peculiar this blog is totaly unrelated to what I was searching for – – interesting to see you’re well indexed in the search engines.
Are grateful for this blog post, it’s tough to find good information and facts on the internet
have already been reading ur blog for a couple of days. really enjoy what you posted. btw i will be doing a report about this topic. do you happen to know any great websites or forums that I can find out more? thanks a lot.
It’s clear you’re passionate about the issues.
This website has lots of really useful stuff on it. Thanks for informing me.
You certainly deserve a round of applause for your post and more specifically, your blog in general. Very high quality material!
I loved your idea there, I tell you blogs are so exciting sometimes like looking into people’s private life’s and work. Every new remark wonderful in its own right.
Assume you are doing good linking to position you on the first pages of search engines.
This contained some excellent tips and tools. Great blog publication.
Wow, amazing blog layout! How long have you been blogging for? you make blogging look easy. The overall look of your site is wonderful, let alone the content!
Thank you a lot for sharing this with all folks you actually recognize what you’re speaking about! Bookmarked. Please additionally visit my site =). We can have a hyperlink trade contract among us!
You are one talented writer thank you for the post.
Great write-up, I am a big believer in placing comments on sites to inform the blog writers know that they’ve added something advantageous to the world wide web!
A neighbor of mine encouraged me to take a look at your blog site couple weeks ago, given that we both love similar stuff and I will need to say I am quite impressed.
You are my inspiration , I possess few web logs and very sporadically run out from to brand 🙁
I like to spend my free time by scanning various internet resources. Today I came across your website and I found it has some of the most practical and helpful information I’ve seen.
This will be helpful for my family.
Magnificent beat ! Can I be your apprentice? Just kidding!
Thanks , I’ve recently been searching for info about this topic for ages and yours is the best I have discovered so far. But, what concerning the bottom line? Are you certain concerning the source?
A thoughtful insight and ideas I will use on my blog. You’ve obviously spent some time on this. Congratulations
?Brindemos por cada descubridor de riquezas !
En crypto casino no kyc encuentras derivados de apuestas negociables. Puedes especular sobre resultados futuros activamente. Los mercados financieros convergen en casinosinverificacion.org/.
Los casino sin registro ofrecen bonos sin depГіsito para probar la plataforma. Puedes jugar gratis antes de comprometer fondos propios. El casino sin dni te permite experimentar sin riesgos.
Visita casinosinverificacion.org/ y gana sin restricciones – п»їhttps://casinosinverificacion.org/
?Que la fortuna te sonria con que alcances grandiosos jugadas exitosas !
I love what you’ve created here, this is definitely one of my favorite sites to visit.
This blog post is excellent, probably because of how well the subject was developed. I like some of the comments too.
Please let us know when you plan to publish your book!
Great post, keep up the good work, I hope you don’t mind but I’ve added on my blog roll.
This is something that will need all of our combined efforts to address.
When are you going to post again? You really entertain me!
I believe this web site has some really wonderful info for everyone : D.
I think other website proprietors should take this web site as an model, very clean and great user pleasant style and design .
I really believe you will do well in the future I appreciate everything you have added to my knowledge base.
Awesome post. It’s so good to see someone taking the time to share this information
Glad to be one of several visitors on this awful internet site : D.
What’s Happening i’m new to this, I stumbled upon this I’ve found It positively useful and it has aided me out loads. I hope to contribute & help other users like its aided me. Great job.
Fantastic piece of writing here1
Keep it up!. I usually don’t post in Blogs but your blog forced me to, amazing work.. beautiful A rise in An increase in An increase in.
I have to disagree with most of the comments here, but maybe I’m just a contrarian.
We’re developing a conference, and it looks like you would be a great speaker.
You are good writer. Thank you.
Easily, the post is really the greatest on this laudable topic. I concur with your conclusions and will thirstily look forward to your future updates. Saying thank will not just be sufficient, for the wonderful c lucidity in your writing. I will instantly grab your rss feed to stay privy of any updates. Solid work and much success in your business enterprise!
I am lucky that I discovered this website , precisely the right info that I was searching for! .
Easily, the post is really the greatest on this laudable topic. I concur with your conclusions and will thirstily look forward to your future updates. Saying thank will not just be sufficient, for the wonderful c lucidity in your writing. I will instantly grab your rss feed to stay privy of any updates. Solid work and much success in your business enterprise!
Hi, do have a e-newsletter? In the event you don’t definately should get on that piece…this web site is pure gold!
This website has lots of really useful stuff on it. Thanks for informing me.
Thanks for posting this. Looking for these resources 😀
Cherished is likely to be what people say about your comments.
Took me time to read the material, but I truly loved the article. It turned out to be very useful to me.
Just a quick note to express my appreciation. Take care
Well, I don’t know if that’s going to work for me, but definitely worked for you! 🙂 Excellent post!
It sounds like you’re creating problems yourself by defining this as such a comprehensive, almost unknowable problem. Isn’t that self-defeating?
The clarity in your post is just nice and I can tell you are an expert in the subject matter.
Greetings… your blog is very interesting and beautifully written.
Clear, concise and easy to access.
Thank you for the auspicious writeup.
Hello, I think your blog might be having browser compatibility issues. When I look at your website in Chrome, it looks fine but when opening in Internet Explorer, it has some overlapping. I just wanted to give you a quick heads up! Other than that, awesome blog!
I like what you have to offer. Keep up the good work!
It is perfect time to make some plans for the future and it is time to be happy. I’ve read this post and if I could I want to suggest you some interesting things or suggestions. Perhaps you can write next articles referring to this article. I wish to read more things about it!
I just couldn’t leave your web site prior to suggesting that I really enjoyed the standard info an individual supply to your guests? Is going to be again continuously in order to inspect new posts
Clear, concise and easy to access.
Thanks For This Blog, was added to my bookmarks.
Nice blog. Could someone with little experience do it, and add updates without messing it up? Good information on here, very informative.
Its just like you read my thoughts! It’s like reading about my family.
Thanks for posting this. Looking for these resources 😀
I want to see your book when it comes out.
I am glad to be a visitor on this website!, regards for this rare information!
Howdy I wanted to write a new remark on this page for you to be able to tell you just how much i actually Enjoyed reading this read. I have to run off to work but want to leave ya a simple comment. I saved you So will be returning following work in order to go through more of yer quality posts. Keep up the good work.
thank, I thoroughly enjoyed reading your article. I really appreciate your wonderful knowledge and the time you put into educating the rest of us.
I’m partial to blogs and i actually respect your content. The article has actually peaks my interest. I am going to bookmark your site and preserve checking for new information.
Thanks , I’ve recently been searching for info about this topic for ages and yours is the best I have discovered so far. But, what concerning the bottom line? Are you certain concerning the source?
Amazing! Your site has quite a few comment posts. How did you get all of these bloggers to look at your site I’m envious! I’m still studying all about posting articles on the net. I’m going to view pages on your website to get a better understanding how to attract more people. Thank you!
Took me time to read the material, but I truly loved the article. It turned out to be very useful to me.
There are some serious financial ramifications here.
What’s Happening i’m new to this, I stumbled upon this I’ve found It positively useful and it has aided me out loads. I hope to contribute & help other users like its aided me. Great job.
Hi my family member! I want to say that this article is amazing, great written and include approximately all important infos. I’d like to see more posts like this .
I’ve read several good stuff here. Definitely worth bookmarking for revisiting. I surprise how much effort you put to make such a magnificent informative site.
Can I just say what a relief to seek out someone who actually knows what theyre speaking about on the internet. You positively know find out how to bring a problem to mild and make it important. Extra individuals have to read this and perceive this side of the story. I cant believe youre not more in style because you positively have the gift.
I just added this to my favorites. I truly love reading your posts. Tyvm!
Just stumble upon your blog from from time to time. nice article
We need to build frameworks and funding mechanisms.
There is perceptibly a lot to identify about this. I consider you made some good points in features also.
I don’t normally comment but I gotta say appreciate it for the post on this one : D.
Write more stories, more chapters.
Greetings! This is my first visit to your blog! We are a collection of volunteers and starting a new initiative in a community in the same niche. Your blog provided us beneficial information. You have done a wonderful job!
WoW decent article. Can I hire you to guest write for my blog? If so send me an email!
I would really like to appreciate the endeavors you cash in on written this article. I’m going for the similar best product from you finding out in the foreseeable future as well. Actually your creative writing abilities has urged me to begin my very own blog now. Genuinely the blogging is distributing its wings rapidly. Your write down is often a fine illustration showing it.
When are you going to take this to a full book?
Certainly. And I have faced it. Let’s discuss this question. Here or in PM.
I encountered your site after doing a search for new contesting using Google, and decided to stick around and read more of your articles. Thanks for posting, I have your site bookmarked now.
very good post, i certainly love this web site, keep on it
Beneficial Blog! I had been simply just debating that there are plenty of screwy results at this issue you now purely replaced my personal belief. Thank you an excellent write-up.
I like your quality that you put into your writing . Please do continue with more like this.
Hello there, You have done an incredible job. I will certainly digg it and personally recommend to my friends. I am sure they will be benefited from this site.
Its just like you read my thoughts! It’s like reading about my family.
Admiring the time and effort you put into your site and detailed info you offer!
I think this is among the so much vital info for me. And i’m happy reading your article. But wanna remark on few common issues, The site style is wonderful, the articles is really excellent : D. Just right job, cheers
I found your blog through google and I must say, this is probably one of the best well prepared articles I have come across in a long time. I have bookmarked your site for more posts.
I’m impressed, I need to say. Really rarely do I encounter a blog that’s both educational and entertaining, and let me tell you, you have hit the nail on the head.
It’s the best time to make some plans for the future and it is time to be happy. I’ve read this post and if I could I wish to suggest you some interesting things or tips. Maybe you can write next articles referring to this article. I wish to read even more things about it!
Sweet blog! I found it while browsing on Yahoo News. Do you have any tips on how to get listed in Yahoo News? I’ve been trying for a while but I never seem to get there! Thank you
Of course, what a great site and informative posts, I will add backlink – bookmark this site? Regards, Reader
Excellent article!! I am an avid reader of your website:D keep on posting that good content. and I’ll be a regular visitor for a very long time!!
I really believe you will do well in the future I appreciate everything you have added to my knowledge base.
Admiring the time and effort you put into your site and detailed info you offer!
You are my inhalation , I possess few web logs and very sporadically run out from to brand 🙁
I will share you blog with my sis.
Well done! Keep up this quality!
You are my inhalation , I possess few web logs and very sporadically run out from to brand 🙁
I absolutely adore your site! You aggressive me as able-bodied as all the others actuality and your broiled PS is absolutely great!
That’s some inspirational stuff. Never knew that opinions might be this varied. Thanks for all the enthusiasm to supply such helpful information here.
whoah this weblog is great i really like studying your articles. Stay up the great work! You already know, lots of persons are looking round for this information, you can aid them greatly.
Certainly. And I have faced it. Let’s discuss this question. Here or in PM.
Nice post.Very useful info specifically the last part 🙂 Thank you and good luck.
How long does it take you to write an article like this?
When we look at these issues, we know that they are the key ones for our time.
Wow, amazing blog layout! How long have you been blogging for? you make blogging look easy. The overall look of your site is wonderful, let alone the content!
Just wanna admit that this is extremely helpful, Thanks for taking your time to write this.
I wish I could craft such articles as this. Thank you very much.
How do I subscribe to your blog? Thanks for your help.
I have been surfing online more than three hours today, yet I never found anything that grabbed my interest as much as this piece.
Unquestionably believe that which you said. Your favorite reason seemed to be on the net the easiest thing to be aware of. I say to you, I certainly get annoyed while people consider worries that they plainly don’t know about. You managed to hit the nail on the head. Will probably be back to get more. Thanks
Sweet blog! I found it while browsing on Yahoo News. Do you have any tips on how to get listed in Yahoo News? I’ve been trying for a while but I never seem to get there! Thank you
I really believe you will do well in the future I appreciate everything you have added to my knowledge base.
The start of a fast-growing trend?
My brother suggested I might like this websiteHe was once totally rightThis post truly made my dayYou can not imagine simply how a lot time I had spent for this information! Thanks!
Good post. I study something more difficult on different blogs everyday. It’s going to always be stimulating to learn content material from other writers and observe a little bit one thing from their store. I’d prefer to use some with the content material on my blog whether you don’t mind. Natually I’ll give you a link in your web blog. Thanks for sharing.
OK, you outline what is a big issue. But, can’t we develop more answers in the private sector?
Abnormal this put up is totaly unrelated to what I was searching google for, but it surely used to be listed at the first page. I suppose your doing one thing proper if Google likes you adequate to place you at the first page of a non similar search.
There is perceptibly a lot to identify about this. I consider you made some good points in features also.
Great post. Just a heads up – I am running Ubuntu with the beta of Firefox and the navigation of your blog is kind of broken for me.
Very Interesting Information! Thank You For Thi Information!
I feel that is among the so much significant info for me. And i am satisfied studying your article. However should commentary on some basic issues, The site style is ideal, the articles is in reality excellent : D. Excellent activity, cheers
Thanks for a Interesting item; I enjoyed it very much. Regards Sang Magistrale
I just couldn’t leave your web site prior to suggesting that I really enjoyed the standard info an individual supply to your guests? Is going to be again continuously in order to inspect new posts
I have been surfing online more than three hours today, yet I never found anything that grabbed my interest as much as this piece.
WoW decent article. Can I hire you to guest write for my blog? If so send me an email!
Thanks for posting this. Looking for these resources 😀
Have you always been concerned about these issues?
Enjoyed studying this, very good stuff, thanks.
My coder is trying to convince me to move to .net from PHP. I have always disliked the idea because of the expenses. But he’s tryiong none the less. I’ve been using WordPress on numerous websites for about a year and am nervous about switching to another platform. I have heard great things about blogengine.net. Is there a way I can import all my wordpress posts into it? Any help would be really appreciated!
Hello. Great job. I did not expect this on a Wednesday. This is a great story. Thanks!
Howdy I wanted to write a new remark on this page for you to be able to tell you just how much i actually Enjoyed reading this read. I have to run off to work but want to leave ya a simple comment. I saved you So will be returning following work in order to go through more of yer quality posts. Keep up the good work.
Assume you are doing good linking to position you on the first pages of search engines.
I think it is a nice point of view. I most often meet people who rather say what they suppose others want to hear. Good and well written! I will come back to your site for sure!
Nice Post. It’s really a very good article. I noticed all your important points. Thanks.
Dude.. I am not much into reading, but somehow I got to read lots of articles on your blog. Its amazing how interesting it is for me to visit you very often. –
Our community leaders need to read this, and look at developing some of your recommendations.
Greetings… your blog is very interesting and beautifully written.
Nice blog here! Also your web site loads up very fast! What host are you using? Can I get your affiliate link to your host? I wish my web site loaded up as fast as yours lol
This information is very important and you’ll need to know this when you constructor your own photo voltaic panel.
With internet full of dupe articles it is nice to find original content like yours thank you so very much.
Great post. Just a heads up – I am running Ubuntu with the beta of Firefox and the navigation of your blog is kind of broken for me.
Abnormal this put up is totaly unrelated to what I was searching google for, but it surely used to be listed at the first page. I suppose your doing one thing proper if Google likes you adequate to place you at the first page of a non similar search.
It’s the best time to make some plans for the future and it is time to be happy. I’ve read this post and if I could I wish to suggest you some interesting things or tips. Maybe you can write next articles referring to this article. I wish to read even more things about it!
If you don’t mind, where do you host your weblog? I am looking for a very good web host and your webpage seams to be extremely fast and up most the time…
Nice blog. Could someone with little experience do it, and add updates without messing it up? Good information on here, very informative.
This is my first time i visit here. I found so many helpful stuff in your website especially its discussion. From the tons of responses on your posts, I guess I am not the only one having all the enjoyment here! keep up the excellent work
Thank you a lot for sharing this with all folks you actually recognize what you’re speaking about! Bookmarked. Please additionally visit my site =). We can have a hyperlink trade contract among us!
This blog post is excellent, probably because of how well the subject was developed. I like some of the comments too though I could prefer we all stay on the subject in order add value to the subject!
Hello. Great job. I did not expect this on a Wednesday. This is a great story. Thanks!
I would share your post with my sis.
Thanks for some other great post. Where else may anybody get that kind of information in such an ideal method of writing? I’ve a presentation next week, and I am at the look for such information.
It’s continually awesome when you can not only be informed, but also entertained! I’m sure you had fun writing this article. Regards, Clotilde.
What’s Happening i’m new to this, I stumbled upon this I’ve found It positively useful and it has aided me out loads. I hope to contribute & help other users like its aided me. Great job.
Most often since i look for a blog Document realize that the vast majority of blog pages happen to be amateurish. Not so,We can honestly claim for which you writen is definitely great and then your webpage rock solid.
You certainly deserve a round of applause for your post and more specifically, your blog in general. Very high quality material!
Great blog here! Additionally your website rather a lot up very fast! What host are you the usage of? Can I get your associate link for your host? I desire my website loaded up as fast as yours lol
Howdy! I simply wish to give a huge thumbs up for the great information you have here on this post. I will be coming again to your weblog for extra soon.
I concur with your conclusions and will eagerly look forward to your future updates. The usefulness and significance is overwhelming and has been invaluable to me!
I’ve thought about posting something about this before. Good job! Can I use part of your post in my blog?
I came across an article that talks about the same thing but even more and when you go deeper.
Abnormal this put up is totaly unrelated to what I was searching google for, but it surely used to be listed at the first page. I suppose your doing one thing proper if Google likes you adequate to place you at the first page of a non similar search.
I had highly recommend this blog to my good friend, it’s so good
Well, I don’t know if that’s going to work for me, but definitely worked for you! 🙂 Excellent post!
Thanks for another great post. Where else may anybody get that type of info in such an ideal way of writing? I have a presentation next week, and I’m at the search for such information.
We are a group of volunteers and starting a new initiative in our community. Your blog provided us with valuable information to work on|.You have done a marvellous job!
Very fine blog.
Advanced reading here!
Thank you for this great piece of content. Best Regards
A colleague in the field told me to check out your website.
I appreciate, cause I found just what I was looking for. You’ve ended my four day long hunt! God Bless you man. Have a great day. Bye -.
However, it is virtually all done with tongues rooted solidly in cheeks, and everyone has absolutely nothing but absolutely love for his or her friendly neighborhood scapegoat. The truth is, he is not just a pushover. He is basically that special variety of person strong enough to take all of that good natured ribbing for exactly what it is.
I would share your post with my sis.
I really believe you will do well in the future I appreciate everything you have added to my knowledge base.
I am lucky that I discovered this website , precisely the right info that I was searching for! .
I favored your idea there, I tell you blogs are so helpful sometimes like looking into people’s private life’s and work.At times this world has too much information to grasp. Every new comment wonderful in its own right.
I am glad to talk with you and you give me great help
The post is absolutely great! Lots of great info and inspiration, both of which we all need! Also like to admire the time and effort you put into your blog and detailed information you offer! I will bookmark your website!
Of course, what a great site and informative posts, I will add backlink – bookmark this site? Regards, Reader
Hey very cool site!! Man .. Beautiful .. Amazing .. I will bookmark your website and take the feeds also…I’m happy to find so many useful information here in the post, we need develop more strategies in this regard, thanks for sharing. . . . . .
I believe this web site has some really wonderful info for everyone : D.
If most people wrote about this subject with the eloquence that you just did, I’m sure people would do much more than just read, they act. Great stuff here. Please keep it up.
Great info! Keep post great articles.
You ma’am have a way with words. Thank you very much!
I think that may be an interesting element, it made me assume a bit. Thanks for sparking my considering cap. On occasion I get so much in a rut that I simply really feel like a record.
I just couldn’t leave your web site prior to suggesting that I really enjoyed the standard info an individual supply to your guests? Is going to be again continuously in order to inspect new posts
The sketch is tasteful, your authored material stylish.
You have some helpful ideas! Maybe I should consider doing this by myself.
Just want to say what a great blog you got here!I’ve been around for quite a lot of time, but finally decided to show my appreciation of your work!
I love what you’ve created here, this is definitely one of my favorite sites to visit.
I feel that is among the so much significant info for me. And i am satisfied studying your article. However should commentary on some basic issues, The site style is ideal, the articles is in reality excellent : D. Excellent activity, cheers
Are the issues really as complex as they seem?
I’d like to be able to write like this, but taking the time and developing articles is hard…. Takes a lot of effort.
It’s the best time to make some plans for the future and it is time to be happy. I’ve read this post and if I could I wish to suggest you some interesting things or tips. Maybe you can write next articles referring to this article. I wish to read even more things about it!
Of course, what a great site and informative posts, I will add backlink – bookmark this site? Regards, Reader
?Celebremos a cada forjador del sino!
casinos sin licencia espaГ±ola permiten mГєltiples formas de pago modernas. Un casino sin licencia espaГ±a elimina restricciones innecesarias. casinos sin licencia en espaГ±a Usuarios confГan en caponesaurora.es por su eficiencia.
casinos sin licencia espaГ±a brindan acceso inmediato a miles de juegos. Un casino sin licencia espaГ±ola mejora la experiencia del usuario. caponesaurora.es se posiciona como referente.
Flexibilidad de pago en casinos sin licencia en espaГ±a – caponesaurora.es
?Que la fortuna te favorezca con que el azar te ofrezca vibrantes ganancias sorpresivas !
?Brindiamo per ogni trionfatore del massimo premio ! Explorar
propio. Muchos usuarios confГan en
La mejor forma de usar tiradasgratissindeposito.es de manera segura – tiradasgratissindeposito.es/
?Che la fortuna ti sorrida con che tu ottenga straordinari premi meravigliosi !
We can see that we need to develop policies to deal with this trend.
I like your blog. It sounds every informative.
Very often I go to see this blog. It very much is pleasant to me. Thanks the author
Developing a framework is important.
Well done! Keep up this quality!
Best American Healthcare University offers CNA certification training classes Online. Train from anywhere in California. Complete the 160 hybrid course. Clinical hours are completed in person in a skilled nursing facility. This program is state approved. Remember certification only comes after the student successfully passes the state exam. You only need your phone for the online class and a google chrome browser. A computer is great, but not necessarily needed. 951 637 8332. Enroll now at https://www.bestamericanhealthed.com/online-cna-program
Keep it up!. I usually don’t post in Blogs but your blog forced me to, amazing work.. beautiful A rise in An increase in An increase in.
Best American Healthcare University offers CNA certification training classes Online. Train from anywhere in California. Complete the 160 hybrid course. Clinical hours are completed in person in a skilled nursing facility. This program is state approved. Remember certification only comes after the student successfully passes the state exam. You only need your phone for the online class and a google chrome browser. A computer is great, but not necessarily needed. 951 637 8332. Enroll now at https://www.bestamericanhealthed.com/online-cna-program
Our community leaders need to read this, and look at developing some of your recommendations.
I want to see your book when it comes out.
It sounds like you’re creating problems yourself by defining this as such a comprehensive, almost unknowable problem. Isn’t that self-defeating?
We are a group of volunteers and starting a new initiative in our community. Your blog provided us with valuable information to work on|.You have done a marvellous job!
There most be a solution for this problem, some people think there will be now solutions, but i think there wil be one.
of course like your web-site however you have to check the spelling on several of your posts. Many of them are rife with spelling problems and I find it very troublesome to tell the reality then again I will surely come back again.
Amazing content on your website.
Hi, possibly i’m being a little off topic here, but I was browsing your site and it looks stimulating. I’m writing a blog and trying to make it look neat, but everytime I touch it I mess something up. Did you design the blog yourself?
very good post, i certainly love this web site, keep on it
Thanks for some other great post. Where else may anybody get that kind of information in such an ideal method of writing? I’ve a presentation next week, and I am at the look for such information.
These stories are so important.
Cherished is likely to be what people say about your comments.
Hello there, You have done an incredible job. I will certainly digg it and personally recommend to my friends. I am sure they will be benefited from this site.
Hi my family member! I want to say that this article is amazing, great written and include approximately all important infos. I’d like to see more posts like this .
A thoughtful insight and ideas I will use on my blog. You’ve obviously spent some time on this. Congratulations
I concur with your conclusions and will eagerly look forward to your future updates. The usefulness and significance is overwhelming and has been invaluable to me!
Admiring the time and effort you put into your site and detailed info you offer!
It’s a comprehensive, yet fast read.
Greetings, have tried to subscribe to this websites rss feed but I am having a bit of a problem. Can anyone kindly tell me what to do?’
I’m so happy to read this. This is the type of manual that needs to be given and not the random misinformation that’s at the other blogs. Appreciate your sharing this best doc.
Glad to be one of several visitors on this awful internet site : D.
I just added this to my favorites. I truly love reading your posts. Tyvm!
Thanks a bunch for sharing this with all people you really recognize what you are talking about! Bookmarked. Kindly also seek advice from my web site =). We can have a link alternate contract between us!
Just came from google to your website have to say thanks.
A friend of mine advised me to review this site. And yes. it has some useful pieces of info and I enjoyed reading it.
Nice blog here! Also your web site loads up very fast! What host are you using? Can I get your affiliate link to your host? I wish my web site loaded up as fast as yours lol
Lovely just what I was looking for. Thanks to the author for taking his clock time on this one.
Took me time to read all the comments, but I really enjoyed the article. It proved to be Very helpful to me and I am sure to all the commenters here It’s always nice when you can not only be informed, but also entertained I’m sure you had fun writing this article.
This information is very important and you’ll need to know this when you constructor your own photo voltaic panel.
I enjoy your blog posts, saved to my bookmarks!
Your dedication to quality really shows here.
This is one of the most exciting posts I’ve read in a long time!
You’re such a vibrant writer — this was amazing!
You have a remarkable way of connecting ideas.
You’re raising the bar with posts like this.
I’m consistently impressed by the quality of your work.
Just WOW. This exceeded every expectation!
This is insanely good — bookmarking immediately!
Absolutely brilliant — I’ll be bookmarking this!
This is one of the most exciting posts I’ve read in a long time!
Such a dynamic and exciting piece — I’m impressed!
You’ve done an amazing job explaining this.
Your enthusiasm makes learning fun — brilliant job!
This is content worth celebrating — phenomenal job!
I can feel your excitement through the screen — awesome!
This post had me completely fired up — thank you!
I learned so much from this one article.
This was such an electrifying read — awesome job!
You make learning so enjoyable — thank you!
You have a real talent for simplifying complex subjects.
Your passion elevates every topic — brilliant writing!
I felt the excitement building as I read — fantastic job!
I learned a lot — thank you for sharing!
Absolutely loving the energy and clarity here — wow!
This is one of the most helpful articles I’ve seen recently.
This was both informative and enjoyable — great combo!
You’ve created something truly valuable here.
I’m blown away by the value in this post.
I appreciate the thoughtfulness in everything you write.
Wow!! I’m honestly amazed by how good this was!
This is the kind of content people rave about — amazing!
This absolutely energized my day — thank you!
I learned so many new things from this article.
This post really exceeded my expectations.
Every sentence is infused with excitement — incredible work!
Thank you for putting so much heart into your writing.
Such a thrilling and inspiring read — well done!
This post just made my morning.
I admire the clarity and depth in your writing.
This content stands out from anything else I’ve read on this subject.
This is the kind of writing that keeps readers coming back — excellent!
Your perspective here is so valuable.
You’ve crafted such a thoughtful and detailed piece.
This was refreshingly exciting — loved it!
Such a lively, powerful burst of content — awesome!
I learned so many new things from this article.
This article practically radiates enthusiasm — fantastic!
This made me feel genuinely motivated — thank you!
You always leave readers better informed — thank you!
You truly have a gift for writing.
This was incredibly helpful — thank you!
Thank you for putting so much effort into your work.
This article had my full attention — amazing writing!
This was such a well-structured and thoughtful read.
I can feel the joy behind your words — so refreshing!
This is real quality content — thank you!
Everything about this post screams excellence!
I learned a lot — thank you for sharing!
Such a beautifully expressed and insightful article.
Your energy is absolutely unmatched — fantastic read!
I’m genuinely in awe — this is exceptional!
Amazing content! I’m so glad I found this post.
You’ve got a gift — this is stellar!
This was extremely well written and very helpful.
You truly have a gift for writing.
I’m so glad I found this — what an exciting read!
Your dedication to quality really shows here.
Your energy is absolutely unmatched — fantastic read!
This post had me smiling from start to finish — thank you!
You make complicated concepts feel effortless.
I felt the excitement building as I read — fantastic job!
I love how you break things down so clearly.
Hands down one of the best things I’ve read all week!
Such a vibrant, powerful, exciting read — THANK YOU!
This was packed with value from start to finish.
Everything about this post feels exciting — incredible!
This is adrenaline in written form — AWESOME!
You truly have a gift for writing.
You’ve delivered another gem — well done!
This lit up my whole mood — thank you for this!
Your enthusiasm is magnetic — I love it!
This post shines with passion and energy — fantastic!
Completely captivated from beginning to end — amazing!
This article left me feeling inspired — fantastic work!
Your writing is pure inspiration — so beautifully enthusiastic!
You’ve taken this topic to a whole new level — amazing!
This was incredibly engaging from start to finish.
You always deliver such valuable information — thank you!
You’ve articulated this topic better than anyone else.
This post is absolutely glowing with passion!
Your enthusiasm transforms every topic — incredible writing!
Your talent is showing BIG TIME — wow!
This post was a joy to read — thank you!
You’ve got an amazing ability to simplify things.
Your writing always inspires me.
This pumped me up in the best way possible!
Everything about this post feels exciting — incredible!
The quality of your writing is outstanding.
I learned so many new things from this article.
Your passion jumps off the page — AMAZING read!
I can’t get over how good this is — seriously impressive!
This post had me completely fired up — thank you!
Completely captivated from beginning to end — amazing!
You approach topics with such grace and intelligence.
This post is overflowing with high-energy brilliance!
Your writing radiates excitement — wonderful job!
This was such an enlightening read — thank you for sharing your expertise!
You always deliver such valuable information — thank you!
I’ll definitely be reading more from you.
You’ve got serious talent — this is spectacular!
Your passion for the topic really shines through.
Just WOW. This exceeded every expectation!
You’ve made this topic far more understandable — thank you!
Pure enthusiasm from start to finish — loved every bit!
This was so well organized and easy to understand.
I can tell you put a lot of heart into this — it shows.
This had so much spark and energy — WOW!
You always deliver top-tier writing.
Your writing is always so thoughtful and authentic.
I appreciate how much effort and care you put into this.
Your content is consistently insightful and inspiring.
You’ve delivered another gem — well done!
One of your best pieces yet — absolutely loved it.
You truly have a gift for writing.
This lit up my whole mood — thank you for this!
You always bring a unique and valuable perspective.
You make learning so enjoyable — thank you!
This was so well thought out — excellent work!
I appreciate how you approach topics with such sincerity and detail.
You’ve outdone yourself — what a fun read!
Thank you for putting so much effort into your work.
Your energy is absolutely unmatched — fantastic read!
You’ve created something truly exciting here — well done!
Such a dynamic and exciting piece — I’m impressed!
Your point of view is so refreshing.
You always deliver such valuable information — thank you!
Such a spirited, exciting perspective — loved it!
This content stands out from anything else I’ve read on this subject.
Your point of view is so refreshing.
This was so well organized and easy to understand.
You’re becoming one of my favorite writers online.
This is one of the best explanations I’ve come across on this topic.
This absolutely energized my day — thank you!
This made me feel so motivated — thank you!
You have such an authentic and compelling voice.
Thank you for sharing something so thoughtful and well crafted.
This is the kind of post that sticks with you — amazing!
You have a real talent for breaking down complex ideas.
This post is bursting with value — amazing!!
This was smart, helpful, and beautifully written.
This is top-tier enthusiastic writing — amazing!
This post had me completely fired up — thank you!
You’ve beautifully expressed ideas many struggle to articulate.
Such a powerful and well-written post.
You’ve outdone yourself with this one.
This article left me feeling inspired — fantastic work!
This is real quality content — thank you!
Everything about this post feels exciting — incredible!
There’s real magic in the way you write — amazing job!
This was refreshingly exciting — loved it!
Your passion brings this content to life — excellent work!
This had me hooked from the very first sentence — incredible work!
You write with such spark — I’m genuinely impressed!
Your passion makes every paragraph shine — beautiful work!
Your blog is truly becoming a go-to resource.
This was both insightful and enjoyable — perfect combination.
?Levantemos nuestras copas por cada creador de prosperidad !
Algunos jugadores recurren a casinos online fuera de espana para disfrutar de opciones exclusivas. casino fuera de espaГ±a Suelen incorporar funciones avanzadas para mejorar la experiencia del usuario. Por ello casinos online fuera de espana se ha convertido en una elecciГіn atractiva para quienes buscan mГЎs libertad.
La comunidad de apostadores destaca casinos fuera de espaГ±a por su oferta global. Incluyen herramientas modernas que facilitan sesiones mГЎs dinГЎmicas. Por ello casinos fuera de espaГ±a se ha convertido en una elecciГіn atractiva para quienes buscan mГЎs libertad.
casinosonlinefueradeespana: Disfruta de casinosonlinefueradeespana desde tu mГіvil – п»їhttps://bodegaslasangrederonda.es/en/
?Que la fortuna te acompane con logros extraordinarios jackpots impresionantes !
?Alcemos nuestros brindis por cada candidato a la victoria !
Los jugadores mГЎs activos suelen elegir casino online sin licencia por su rapidez. casinos online sin licencia Los retiros se procesan sin demoras. Esto genera confianza.
Muchos apostadores investigan casino sin registro gracias a procesos rГЎpidos y sin verificaciГіn extensa. Estas plataformas permiten acceder a funciones exclusivas que no siempre estГЎn disponibles en operadores regulados. El usuario gana autonomГa y comodidad al jugar.
Casino sin licencia en EspaГ±a para jugadores VIP – п»їhttps://casinosinrestricciones.com/
?Que la suerte camine a tu lado con vivencias excepcionales botes colosales !
High Line ist 3,2 km von Even Midtown East – Grand Central, An Ihg Hotel
New York und UN-Hauptquartier ist 550 Meter entfernt.
Das Hotel bietet den perfekten Standort 4 km
vom New York-Stadtzentrum. National September 11 Memorial und Museum ist nur
4,9 km vom Hotel entfernt. Ellis Island ist 4,5 km vom Hotel entfernt, während National September
11 Memorial und Museum 3 km vom Grundstück entfernt ist.
Charles Memorial Park ist 3,5 km und Phil “Scooter” Rizzuto Park ist 3,2 km von der
Unterkunft entfernt.
Besonders hervorzuheben ist die 46 Meter hohe Replik der Freiheitsstatue, die majestätisch am Eingang
des Hotels steht und sowohl bei Tag als auch bei Nacht ein beliebtes Fotomotiv bietet.
Mit über 2.000 Zimmern und Suiten, die von Standardzimmern bis zu luxuriösen Suiten reichen, sowie Annehmlichkeiten wie einem Spa,
Fitnesscenter und Pool, verspricht das Hotel für jeden Besucher etwas Besonderes.
Gelegen am lebhaften Las Vegas Strip in Paradise, Nevada, gehört es zu MGM Resorts International und bietet eine faszinierende Mischung aus Unterhaltung, Gastronomie und Casino-Flair.
Das New York-New York Hotel & Casino ist ein weiteres der beliebtesten Themenhotels in Las Vegas.
New York ist bekannt für seine Vielfalt und bietet auch eine beeindruckende Auswahl an erstklassigen Casino-Hotels, die sowohl Luxus als auch Unterhaltung bieten.
Das Hotel bietet Ihnen den Aufenthalt im Stadtteil Washington Heights.
Befindet sich in New York und bietet ein Kasino, einen Nachtclub und einen Friseurladen. Lincoln Tunnel liegt
in direkter Nähe zum Hotel und Harlem River Greenway ist in knapp 500 Meter erreichbar.
Hier hat ein kurzer Chat genügt, um eine manuelle Gutschrift zu
erhalten. Wenn du erst ein wenig Spielerfahrung an neuen Video Slots sammeln möchtest,
dann kannst du auch einfach die Demo des jeweiligen Spielautomaten starten und
kannst diesen dann ohne den Einsatz von Echtgeld testen. Darunter gesellen sich die klassischen Spielautomaten, interaktive
Automatenspiele und ein Live Casino, in dem du Karten- und Tischspiele sowie Live Dealer Game Shows finden kannst.
VIPs und vollständig verifizierte Spieler erhalten Auszahlungen aber oftmals noch
am selben Tag gutgeschrieben. Alle anderen Zahlungsmethoden setzen eine Mindesteinzahlung zwischen 10€
und 50€ (Kryptowährungen) voraus. Deine Münzen sind dann im
Hugo Casino Shop gegen Freispiele oder einen Echtgeld Bonus eintauschbar.
Der Kundenservice ist rund um die Uhr per Live-Chat und E-Mail erreichbar und bietet meist
deutschsprachige Unterstützung. Spieler erhalten mobilen Zugriff auf die gesamte Spielauswahl, Ein- und Auszahlungen sowie den 24/7 Live-Chat.
Das Hugo Casino bietet auch unterwegs ein erstklassiges Spielerlebnis.
Der FAQ-Bereich kann einfache Fragen oft schneller
beantworten als der Support. Die Registrierung bei Hugo Casino ist einfach
und schnell. Hugo Casino bietet eine beeindruckende Vielfalt an Spielen,
die sowohl für Anfänger als auch für erfahrene Spieler geeignet sind.
Es gelten dieselben Umsatzbedingungen wie beim regulären Neukundenbonus.
Aufgerufen sind 50 % bis 500 EUR sowie 200 Freispiele (vier 50er
Pakete). Alternativ zum klassischen Neukundenbonus gibt es einen VIP-Willkommensbonus.
Videopoker, Roulette, Blackjack, Baccarat und andere Tischspiele sind
ausgenommen. Für dritte Einzahlung sind 30 EUR für das
Bonusgeld, jedoch 50 EUR für das Bonusgeld und die Freispiele (vier 25er Pakete)
notwendig.
Mit dem Aufkommen der Automatenspiele kamen bis
heute noch unzählige Spielhallen hinzu.
Ein deutsches Online Casino muss über unterschiedliche Mechanismen verfügen, die eine
Glücksspielsucht verhindern sollen. Wer derzeit in Deutschland online im Casino spielt, befindet
sich beim Spielen von Online Slots und Co in einer Art
Grauzone.
Nicht alle Online Casinos in Österreich stehen für eine sichere und zuverlässige Glücksspielerfahrung.
Spieler profitieren von einer großen Spielauswahl, die besonders bei Anbietern ohne deutsche Lizenz oft noch umfangreicher ist.
Eine umfassende und gut gepflegte Online Casino Liste ist für deutsche Spieler ein unverzichtbares Werkzeug, um
im umfangreichen Angebot der Online Glücksspielanbieter den Überblick zu behalten. Die regelmäßige Aktualisierung der Liste
stellt sicher, dass nur die besten Online Casinos mit deutscher Lizenz und einem umfassenden Angebot an Spielen und
Services empfohlen werden. Die in unserer Online Casinos Liste aufgeführten Top
Anbieter bieten nicht nur eine große Spielauswahl, sondern auch zahlreiche exklusive Vorteile für Spieler in Deutschland.
Egal, ob Sie sich für ein glamouröses Abendkleid, einen eleganten Hosenanzug oder einen lässigen-chic
Look entscheiden, achten Sie darauf, dass Ihr Outfit den Casino-Anforderungen entspricht
und einen Hauch von Raffinesse und Stil ausstrahlt. Wenn Sie einen weniger formellen, aber
dennoch stilvollen Look bevorzugen, können Sie einen Hosenanzug in Betracht ziehen. Ob Sie ein Pokerturnier spielen oder einfach nur die Atmosphäre genießen wollen, hier sind einige Casino-Outfit-Ideen für Damen, die Ihnen helfen, Ihren Look zu perfektionieren. Bist du bereit, dein perfektes Casino
Outfit zu kreieren und stilvoll ins Glücksspiel einzutauchen? Wer gepflegt gekleidet ein Casino besuchen will, muss einige Kleidungsstücke
im Kleiderschrank lassen.
Zu unifarbenen Outfits ohne viel „Chichi“ dürfen Frauen im Casino gerne lange Ohhringe, glitzernde Colliers oder auch große
Armreifen tragen. Ob die Schuhe offen oder geschlossen sind, spielt im Casino eine weniger wichtige Rolle.
An dieser Stelle ist ein Blick auf die eigenen Füße meist recht aufschlussreich, denn auch
hier darf es ganz in Casino-Manier stilvoll
und mondän zugehen.
Lockere Freizeitkleidung, wie zum Beispiel Baggy Pants, Jeans oder Flip Flops
sind für jeden Casinobesuch tabu. Kombiniert mit 20er jahre accessoires damen wie federkopfbändern oder perlenketten wird es zum
kompletten, hochwertigen outfit.egal ob du nach
einem charleston kleid für tänzerische performances, einem fransenkleid pailetten für den fasching oder einem eleganten 20er jahre kleid damen für spezielle
anlässe suchst! Beim Automatenspiel hingegen ist
eine gepflegte Freizeitkleidung ausreichend. Wenn Sie ein Casino in einer entspannten Atmosphäre besuchen, wie beispielsweise
ein Casino mit Spielautomaten, können Sie auch
einen legeren, aber dennoch stilvollen Look wählen. Damen, die elegant gekleidet werden, sollten zum Casinobesuch ein bis über das Knie reichendes Cocktailkleid
tragen.
Unser engagiertes Support-Team erhält eine spezielle Schulung, um potenzielle Bedürfnisse an Problemspiel-Unterstützung zu erkennen und anzugehen.
LeoVegas Casino bearbeitet alle Anfragen schnell und diskret, wobei Ihr Wohlbefinden an erster Stelle steht.
Dies ist ein wichtiges Werkzeug für jeden, der das Gefühl hat, dass sein Spiel problematisch wird,
und bietet sofortige Erholung und Zeit zum Nachdenken. Sollten Sie jemals das Bedürfnis verspüren, eine Pause einzulegen, bietet
unsere Selbstausschluss-Option eine unkomplizierte Möglichkeit, Ihr Konto vorübergehend
oder dauerhaft zu schließen. LeoVegas Casino bietet eine umfassende Suite von Funktionen, die Ihnen helfen, die Kontrolle über Ihre Spielaktivitäten zu behalten. Wir
verstehen, dass Glücksspiel manchmal für einige zu einer Herausforderung werden kann.
Kunden können jede Woche ein neues Spiel der
Woche entdecken, für das sie sich entweder Freispiele oder andere
Boni sichern können. Diese reichen von Freispielen und Live
Casino Gratis-Chips, über Slot- und Live Casino-Turniere oder anderen Bonusangeboten wie z.B.
Bei Tischspielen in Live Casinos bist du in deinem Element?
Du kannst entspannt daheim spielen, während andere sich durch allerhand Wetterkapriolen zum
Casino um die Ecke quälen.
Der Film wurde für seine realistische Darstellung von Bond gelobt
und war auch ein kommerzieller Erfolg.”Casino Royale” ist ein packender Thriller mit beeindruckenden Actionsequenzen, einer gut ausgearbeiteten Handlung und einer starken Leistung von Daniel Craig
als James Bond. Der Film handelt von dem britischen Geheimagenten James Bond, der den internationalen Terroristen Le Chiffre aufhalten muss, der durch illegale Pokerspiele Geld
für seine Aktivitäten gewinnen will.Die Hauptrolle des James Bond
wird von Daniel Craig gespielt, während Mads Mikkelsen als Le Chiffre zu sehen ist.
James Bond Casino Royale ist heute auf Platz 303 in den täglichen JustWatch Streaming-Charts.
Denn zum ersten Mal in seiner Agenten-Laufbahn wurde 007 mit einer ambivalenten Persönlichkeit ausgestattet, die von seelischen Abgründen,
Zweifeln und zunehmender Gefühllosigkeit geprägt ist.
So sei die Sequenz, in der Bond aus der Folter befreit wird, ins Komische abgerutscht.
Dieser kam als Ein Quantum Trost zwei Jahre danach in die Kinos und
setzt die Handlung unmittelbar fort, anstatt – wie bisher in der Filmreihe üblich – eine
eigenständige, neue Geschichte zu erzählen. Aufgrund des großen finanziellen Erfolgs wurde
sofort die Arbeit an einem Nachfolgefilm begonnen. Die erste DVD-Version erschien 2007 in einer Standard-Ausführung
sowie mit einer Bonus-DVD und fünf Postkarten.
Dadurch haben die Spieler die Möglichkeit, jederzeit
und überall auf ihre Lieblingsspiele zuzugreifen und ihre
Wetten zu platzieren. Ganz gleich, ob es um Sportwetten in den Bereichen Fußball, Basketball oder eSports
geht – Mostbet Deutschland bietet vielfältige Wettmöglichkeiten für jede Sportart.
Die Oberfläche der Plattform ist für schnelles und einfaches Wetten konzipiert.
Die Welt der Videospiele hat sich zu einer der Sportkategorien entwickelt, die bei jungen Wettenden den größten Anklang
findet. Der Ersteinzahlungsbonus ist nur der Anfang eines endlosen Katalogs von Promotionen, die
bei Mostbet aktiviert werden können. Mostbet Casino Bonus
verdoppelt die erste Einzahlung bis zu 300 € + 125 Freispiele.
Vergessen Sie nicht, verantwortungsbewusst zu spielen und Ihr Budget im
Auge zu behalten. Sie können von großzügigen Willkommensangeboten,
Einzahlungsboni und Freispielen profitieren, um Ihre Gewinnchancen zu erhöhen.
Hier finden Sie eine Vielzahl von Möglichkeiten, um Ihre Gewinne zu maximieren und das Beste aus Ihren Online-Wetten und Glücksspielen zu machen.
Welche Spielvarianten die Plattform bietet, erfahren Sie weiter unten. Spielen Sie
Ihre Lieblingsspielautomaten, Roulette,
Karten und viele andere Spiele. Der wichtigste Vorteil wird die Möglichkeit sein, nicht nur Sportwetten zu platzieren, sondern auch im Mostbet Online Casino.
Um ein ehrliches Glücksspielgeschäft zu betreiben, müssen Sie transparente Geschäftsregeln befolgen. Mostbet bietet seinen Spielern eine vielfältige Auswahl an Boni und Aktionen. Der Kundenservice steht den Nutzern rund um die Uhr zur Verfügung
und gewährleistet eine schnelle und professionelle Bearbeitung aller Anfragen und Anliegen.
Alle Spiele starten sofort in Ihrem Lieblingsbrowser, Sie müssen also
keine zusätzlichen Plugins herunterladen. Mit jedem Update erhalten Sie eine bessere Navigation und neue Funktionen, sodass Ihr Spielerlebnis immer auf dem neuesten Stand ist.
Sie können sofort mit dem Spielen sowohl auf Android- als auch auf iOS-Geräten beginnen, da unsere Software auf beiden perfekt funktioniert.
Insgesamt sind bis zu 400 € Bonusguthaben sowie 100 Freispiele für ausgewählte Slots möglich.
Neue Kundinnen und Kunden erhalten im Winspirit Casino ein attraktives Willkommenspaket.
Spielen Sie sicher – setzen Sie sich Grenzen,
machen Sie Pausen und wenden Sie sich bei Bedarf an den Support.
Winspirit bietet rund um die Uhr mehrsprachigen Support, großzügige Cashback-Angebote, Turniere und maßgeschneiderte Aktionen für jeden Spieler.
Winspirit bietet einen umfassenden Kundendienst, der rund um die Uhr verfügbar ist, um alle Fragen und Anliegen zu klären. Ja, neue Spieler bei Winspirit können von verschiedenen Bonusangeboten profitieren, darunter
ein Willkommensbonuspaket, das einen Prozentsatz des ersten Einzahlungsguthabens erhöhen kann.
Wenn Sie unserem VIP-Club beitreten, erhalten Sie mehr als nur regelmäßige Belohnungen. Spielen Sie einfach regelmäßig
Ihre Lieblingsspiele und erfüllen Sie die Voraussetzungen, um teilnahmeberechtigt zu sein. Wenn Sie VIP werden,
erhalten Sie Vorteile, die zeigen, wie loyal und aktiv Sie sind.
Nehmen Sie am VIP-Programm unseres Casinos teil, um zusätzliche Vorteile
zu erhalten. WinSpirit schützt Sie und stellt sicher, dass
es gut funktioniert.
Gäste können aus einer breiten Palette an klassischen Tischspielen wie
amerikanischem Roulette, Black Jack und Punto Banco wählen. Die Spielbank Enschede liegt in einer schönen Umgebung, bietet eine gehobene Gastronomie und strahlt einen ganz besonderen Charme aus.
Das Apartment liegt in nur 10 Gehminuten Entfernung vom Stadtzentrum.
Auch große Pokerturniere, die hier regelmäßig stattfinden und bekannte Pokerstars nach Enschede ziehen sind ein Publikumsmagnet, für
das sich der Ausflug über die Grenze definitiv lohnt.
An vielen Wochenenden findet abends nämlich Livemusik statt.
Für alle, die zu später Stunde noch Hunger bekommen,
gibt es im Saal diverse niederländische Snacks, die direkt an der
Bar bestellt werden können. Auch wenn Glücksspiele nicht so dein Ding sind, lohnt sich
ein Abendessen hier, es ist einfach ein wahres Erlebnis!
Die Speisekarte wechselt regelmäßig und bietet neben diversen Klassikern auch wechselnde saisonale Gerichte und Spezialitäten des Chefkochs.
Ganz in der Nähe der Ruhrmetropole Dortmund und nur einen Steinwurf
von der Burg Hohensyburg entfernt zieht die zur Westspiel-Gruppe gehörenden Spielbank seit 1985 Casino-Fans in seinen Bann.
Das Parkhaus City-Park-Garage grenzt direkt an die
Spielbank an und verfügt über ausreichend, kostenpflichtige Stellplätze.
Zum Automatenspiel kann hingegen auch im legeren Look erschienen werden. Um das leibliche Wohl der Besucher wird
sich in den attraktiven Barbereichen des Casinos gesorgt, die sowohl
im Klassischen Spiel als auch im Automatensaal zu finden sind.
Diese werden auch als Einsatz an anderen Spielautomaten akzeptiert oder an der Kasse als Bargeld ausgezahlt.
Der Mindesteinsatz an den Spielautomaten bewegt
sich abhängig vom Terminal zwischen 1 Cent bis 2 Euro.
Instead, take a few minutes to review the essentials
— license, security, payments, and game quality.If you’re looking for a casino that ticks all the right boxes, many Aussie players recommend giving SkyCrown Casino a try.
Forums and comparison sites can be great sources of honest feedback.In short, never rush into
signing up just because a casino offers flashy
bonuses or promises big wins. Reliable Customer SupportA strong support team shows the casino cares about its players.
Fast & Aussie-Friendly PaymentsThe best online casinos make it easy for Australians to
deposit and withdraw.
And yes, live players can still use some promos
— including selected skycrown no deposit bonus codes.
New players are welcomed with a multi-stage bonus package covering their first five deposits, along with free
spins on some of the most popular slot games. You can choose from 5,000+ pokie machines and live casino titles with
real-time gameplay. Yes, some online casinos in Australia for real money process and deliver withdrawals in 24 – 48 hours.
If possible, be sure to take advantage of
cashback offers and other bonuses at Australian online casinos.
We’ve come up with some insider tips to help you play smarter, win bigger, and improve your overall gaming experience at safe online casinos in Australia.
I wouldn’t trust this casino at all Set up a Skycrown login and start playing now!
– Licensing, Security & Player Input If you are asking whether Skycrown Casino is a legit casino,
then the answer is definitely YES.
This easy and hassle-free service ensures that users never miss out on their favourite films.
Say goodbye to waiting in long lines and stressing over which seat
to choose – with Ticketnew, you can easily
book your movie tickets online in a few taps and secure your favourite spot.
You can now reserve your favourite movie tickets from the comfort of your
home and enjoy a fun-filled evening at the cinema with
your family and friends.
Upload documents, analyze data, and get insights directly from your files.
You have full control over your data, always. All chat history and custom prompts are
stored exclusively in your browser. This comprises traffic analysis, delivering personalized content, and supporting our marketing efforts.
But staffing customer service departments to meet unpredictable demand, day or night,
is a costly and difficult endeavor. Naturally, timely or even urgent customer issues sometimes arise off-hours, over the weekend or during a holiday.
And if a user is unhappy and needs to speak to a real
person, the transfer can happen seamlessly. The terms chatbot, AI chatbot
and virtual agent are often used interchangeably, which can cause confusion. Artificial
intelligence can also be a powerful tool for developing conversational marketing
strategies. Chatbots can handle real-time actions as routine as a password change,
all the way through a complex multi-step workflow spanning multiple
applications.
Access your winnings quickly with our streamlined withdrawal process, offering some of the fastest payout times in the industry.
The game library is massive – over 2,500 titles from top providers
like BGaming and Pragmatic Play. I play during my commute and the quality matches desktop perfectly.
Set personalized deposit limits to manage your spending,
or take a break with our self-exclusion option. In addition, each moment that
Ripper Casino adds a new game to its collection it is guaranteed to offer exciting new promotions.
Make the Bitcoin or Litecoin each week to get a 20% bonus.
At Ripper Casino, they know how crucial it is
to have reliable support.
Follow these simple steps to start playing your favorite games in minutes.
Enjoy a generous welcome package, weekly promotions, reload bonuses, and a comprehensive loyalty program designed to
maximize your playing value. Instant deposits, withdrawals in hours,
and the casino covers transaction fees. Weekly crypto bonuses
and loyalty rewards keep things exciting. The $7,500 welcome package
transformed my initial deposits into epic gaming sessions.
The aim of the game is for your Poker hand to beat the Dealer’s hand.
Caribbean Stud Poker is based on the traditional Five Card Stud Poker game,
where you play your hand against the Dealer’s hand.
The aim of the game is simply to predict the numbers or combinations that will be revealed
by the tumbling of the dice.
The TaylorMade R1 driver caters to golfers seeking maximum distance and control over their drives.
For a seamless and enhanced shopping experience, please select your
store to discover options near you. For the best experience on our
site, be sure to turn on Javascript in your browser. Reset
multiple control values and all the controls within a form Let’s run the app and click on the Update
the button.
Seeking out casinos that display transparent RTP information can maximize the gaming experience.
These features are crucial in providing a seamless and
enjoyable online casino gaming experience.
Exclusive bonuses and cryptocurrency-specific promotions at mBit Casino boost the overall value for players.
Additionally, ThunderPick hosts a diverse range
of casino games, including slots, table games, and live dealer options.
With a wide variety of titles, from classic slots to innovative video games and table games, players are sure to find something to enjoy.
CasinoNic collaborates with top-tier providers like Microgaming and NetEnt, delivering a diverse
selection of high-quality games.
Regardless of your choice, this online casino search category will help you find the best online casinos that suit your needs!
Customers of Australian online casinos usually want to pay with
Australian Dollars. Above we already went through one way you could go in order to fund your
gameplay at Australian online casino sites. Much like playing online casino games,
investing in cryptocurrencies can be an exhilarating and volatile ride.
In this category, you will find plenty of new Australian online casinos that have just burst on the scene.
Naturally, the same rule applies to Australian online casinos.
Before you can play casino games at BitStarz, you
must ensure you meet the requirements to play at this casino.
With a selection of games offering over 4,400 options, players have a range to
choose from and can enjoy various thrilling experiences.
The results were impressive, with the games perfectly optimized
to fit each device’s screen size, delivering immersive gameplay.
However, you can still take part in the remaining deposit bonuses from the welcome package (if any are left to claim) If a player despite
this would receive free spins without a deposit
being made, all winnings from the spins will be confiscated.
Hence, if you’re looking for an online casino with generous promotions and an impressive game library, BitStarz is my top recommendation.
While there’s no dedicated mobile app or PWA, the casino runs seamlessly in any mobile browser, giving players
full access to its features. Here’s a look at
all the games you can play. You’ll find a massive collection of pokies,
along with table games, live dealer games, instant games, and more.
The casino also features a loyalty program and regular tournaments for pokies and table games.
Play anytime, day or night, at the Crown Casino
Perth in one of Western Australia’s most distinguished and glamorous casino venues.
If you’re in Adelaide and you’re looking for great casino fun where you can indulge, relax and really enjoy yourself, then the Adelaide Casino is for
you. We offer more details in our review.
Victoria’s capital, Melbourne, is a vibrant modern day city that offers something
for everyone, not least the magnificent Crown casino.
Home to the world famous opera house and Harbour Bridge,
the city also plays host to the only casino in NSW. Australia boasts a vibrant landscape
of land-based casinos, offering diverse experiences across its vast territory.
You’ll also find more than 67 gaming tables, a 12-table poker room,
and the Pulse electronic gaming area to enjoy. Grand Villa Casino’s 1,300+
slots beat the libraries at some online casinos available in British Columbia.
They have a few carnival games (like 3 card
poker), but not the traditional table games. The casino
itself has 1,100 slots, electronic blackjack and roulette.
The poker room’s 19 tables are a mixture of real poker tables and carnival games like 1 card poker and Ultimate Texas Hold’em.
In terms of gameplay, there is no player interaction at all.
More importantly, you can play these pokies
right here, for free! You’ll know how to unlock bonuses and how different
symbols work. Playing pokies regularly by phone helps you to hone your mobile
gaming skills. With an Android or iOS smartphone, you can play these pokies anywhere, in your comfort.
So, we’ve lined up some of the best casino online slots in Australia.
Players can interact with dealers and other players, adding a social element to
online gambling. Online pokies are well-known for being popular at best payout casinos in Australia, since they often offer a high RTP.
Browse the casino’s game library and choose from slots, table games, or live dealer options.
In our experience, these platforms offer the best combination of game variety,
bonuses, and security. But to ensure a smooth start, follow these simple steps to register and begin playing at a reputable Australian online casino.
The top mobile casinos let you experience enhanced gameplay, easy account management,
and extensive customer support from your mobile device.
If a casino hides its licensing info or has sketchy reviews,
steer clear.Top Australian online casino sites use 256-bit SSL encryption to protect your
personal and financial data. Always choose casinos licensed by trusted authorities
to stay on the right side of the law.A trustworthy casino displays its license prominently check the footer
of sites. Some of these games are also available in free mode to allow players to test the RTP.
Loyalty pays off at top rated Australian online casino
sites. Deposit bonus offers are used to reward players who regularly fund their accounts.
They let you win real money without a deposit, though winnings often come with higher wagering requirements, like 40x at times up to 70x.
If a casino doesn’t offer a network choice, it almost always means your payment
will go through Layer 1. Layer 1 is the original Ethereum
blockchain, also called the mainnet, and is usually shown as “ETH (ERC-20)” at casinos.
It processes well over a million transactions a day and supports a huge ecosystem
of apps, tokens, and gambling platforms built on top of it.
Thrill’s portfolio is varied and includes more than 3,500 ETH
slots, 8 in-house Provably Fair Originals, over 90 live dealer titles, and a couple of Ethereum crash options.
It features 70+ Ethereum crash gambling titles, 4 Provably Fair Originals, and a dedicated Mega Dice game tied to
unique site-wide promotions. The site has a blockchain-inspired
design, offers Google/Wallet/Telegram login, and
runs on a VPN-friendly, no-KYC setup.
BillyBets Casino offers a diverse gaming experience with over 11,
000 games from 100+ providers and a sportsbook
covering major events. RakeBit Casino is a relatively new crypto-only platform with thousands of games,
a sportsbook, and simple rewarding bonuses, along VIP
Program. Hashlucky is a promising new crypto gambling
site that provides competitive bonuses, loads of games
and a great loyalty program. 0xBet is a new crypto casino and sportsbook that offers an excellent VIP program, featuring
competitive cashback and rakeback rates.
Yes, Crown Perth provides both free and paid parking options, including open-air lots and multi-level covered parking facilities conveniently located near the casino and hotels.
With over 390 stylish rooms and loft-style suites, the hotel
is known for its urban design, generous space, and floor-to-ceiling windows offering stunning views of the city
or Swan River. The fitness centre features the latest Technogym equipment, while the expansive lagoon-style
pool deck offers private cabanas and poolside service. Located in Perth, less than 1 km from
Perth Concert Hall, Hyde Perth provides accommodation with an outdoor swimming pool, private parking, a fitness
centre and a terrace. Featuring panoramic views of
Perth’s city skyline and a rooftop infinity pool, Doubletree By Hilton Perth Waterfront is situated
in Elizabeth Quay, with access to local attractions and experiences…
Staying at Crown Towers Perth is an indulgent experience, with its expansive lagoon pools, unparalleled city views, luxurious spa facilities,
state-of-the-art fitness centre and high-end boutiques.
Located within the vibrant Crown Perth complex, Crown Metropol puts you right next to the city’s best
casino games, fine dining venues, live shows, and shopping options.
The hotel also includes a high-performance fitness studio and family-friendly amenities.
Crown Metropol guests have full access to a large indoor pool
and the spectacular resort-style outdoor pool with relaxing
lounge zones and shaded cabanas. Crown Towers Perth is home
to the renowned Crown Spa, where guests
can indulge in luxurious treatments, steam rooms, vitality pools, and private therapy suites.
The hotel offers an exceptional collection of rooms and suites designed with meticulous attention to detail.
Crown Perth offers ample on-site parking, including multi-level facilities, accessible bays,
and valet parking. Enjoy valet parking, chauffeur services, and secure multi-level parking with
EV charging. The award-winning Crown Spa Perth offers a serene oasis with indulgent treatments, La Prairie facials,
aqua retreats, heated vitality pools, and tranquil massage suites.
Whether visiting for leisure or celebration, Crown Perth’s
hotels offer personalized service, riverside views, and VIP privileges like valet, express check-in,
and spa access. Both hotels are connected to the Crown complex,
offering seamless access to dining, gaming, and entertainment.
The welcome bonus package worth $7,500 plus 150 free spins provides exceptional
value for new players. Lucky Green casino stands out as a
premier destination for Australian online pokies enthusiasts in 2025.
The live chat function lets you interact with dealers and other players in real-time.
The casino stores player funds in segregated accounts separate from operational capital.
Mobile optimization ensures seamless gameplay across all devices without downloads.
Your funds stay protected in segregated accounts while responsible gambling tools help
maintain healthy playing habits. You have 30 days to meet wagering
requirements before bonuses expire. Different games contribute
varying percentages toward requirements – slots count 100% while table games contribute 10%.
Yes, all bonuses carry a 35x wagering requirement applied to
the bonus amount only.
The welcome bonus is one of the most competitive in the Australian online casino market, and it’s tailored to give new players a flying start.
Lucky Green Casino has quickly become one of Australia’s most talked-about online gaming
destinations, offering players a secure, entertaining,
and truly rewarding experience. These pragmatic approaches
help you get the most from the lucky green casino experience while protecting your finances and mental wellbeing.
Australians love gaming on the go, so make sure the casino
is mobile-friendly. But it’s not just about pokies—check if
there are live dealer games, jackpots, and table games to keep your sessions fresh and
varied. A solid casino will offer hundreds of pokies from well-known providers like Pragmatic Play,
NetEnt, and Microgaming. For most Aussie players, real-money pokies are the main attraction. A trusted Casino AU should support AU$
deposits and withdrawals through methods familiar to Australians.
Sky crown casino developed this cashback system after seeing how quickly bankrolls can disappear during unlucky
sessions. Use these funds immediately on any game across the platform.
The system handles everything behind the scenes – calculating
losses and crediting the bonus without any action required.
Players wake up to find 10% of net losses returned directly to their
casino account. After a rough streak at Sky crown casino,
the sting hurts less knowing some money comes back
automatically. When you continue your journey after the
first deposit, even more rewards await you.
Because the Star is located geographically in Sydney’s premium
entertainment area, it’s able to provide accommodations that are uniquely luxurious.
Rocking live bands, hilarious comedians, and engagingly unique musical acts are also on-hand.
The one thing that is missing from the facility is the chance to enjoy electronic gaming.
Whether you are a low stakes player or a high roller, you’ll find the table that’s
just right for you at this casino.
“I’m pretty sure there’s plenty of deals around that can be done to stop it from doing that,” he said.
“To me, it has been a disaster dealing with the management of Star and I think … there is no doubt the board should be blamed for how bad it is,” he told ABC Radio Brisbane.
He said poor management has been the company’s main issue.
Now the chances of losing it all have been turned back onto one of Australia’s biggest casino operators.
At casinos, the odds are never in a punter’s favour.
“Traditionally, probity checks have taken many months for new operators in casinos across the different state jurisdictions,” Mr Jones said.
Unlike subscription-based platforms like Netflix or Hulu, TubiTV
is entirely free, supported by advertisements, and does not require a monthly fee or
account to start watching. While it does offer a great selection of TV shows,
Tubi has a reputation for being the best place to watch free movies online.
Tubi has an extensive library with content across all genres
all for free and available to watch now. You can watch live TV for free on Tubi
across a host of different channels.
But he couldn’t do it without the support of the Tasmanian people who not only voted for the
development but became part of the brand and Wrest Point
story. It was later purchased by Arthur Drysdale who created Tasmania’s prestigious international hotel,
the Wrest Point Riviera. In doing so, Federal Group became part of Tasmanian history and the birth of Australia’s first casino unfolded.
Over five decades the Group busied themselves operating some
of the country’s finest hotels including Savoy Plaza and The Windsor, before turning
their attention to Tasmania, purchasing Wrest Point Riviera Hotel in Sandy Bay.
And neither do the offers and events! Sip something special
at our bars before a night of live entertainment.
Whether you play at the physical casino or online, your loyalty
points and preferences follow you. Streamed in HD and hosted by professional dealers, these tables
offer blackjack, roulette, baccarat, and even game-show-style
games in real time. These luxurious spaces ensure discretion,
personalized service, and a more refined atmosphere
for high-stakes players. The land-based casino at Wrest Point features more than 650
slot machines, offering a thrilling mix of traditional reels, modern video slots, and progressive
jackpots.
National Casino not only offers a thrilling gaming experience but also rewards its loyal members through an exclusive VIP program.
These spins add an extra layer of excitement and opportunity to your initial gaming experience.
National Casino’s welcome bonus is like a grand entrance into the world of online gaming.
From a hefty welcome bonus to free spins that add zing to your play,
there’s something for everyone. Your account also keeps track of your preferences and gaming history, personalizing your experience.
You can now explore an array of games and take advantage of exclusive
offers.
Your login details and game progress sync across all devices.
The mobile site adapts to different screen sizes automatically.
Our mobile website works on all smartphones and
tablets through your device’s browser. You
can make deposits starting from $10 and withdrawals up to
$5,000 daily.
If the issue persists, contact our support team with details about your device and browser so we can investigate and fix
it quickly. Why is basic play this hard? We’re sorry
to hear about your experience. I strongly advise everyone
to stay away from this platform. We’re glad you’re
enjoying the casino. We’re happy to hear you’re enjoying the casino — and we’ll pass
your appreciation on to Kate.
Crown Rewards Members can earn 24 hour free parking on the same visit,
click here for more information. Conveniently located on Little Collins Street, our hotel is located
in close walking distance of the city’s many attractions, events, shopping and
eating destinations. Travelling to Melbourne and want to make the most of your city experience by
visiting Crown Casino Melbourne? Just show your Crown Rewards Card when you pay
or play and you can start earning Points, which
you can redeem for Crown experiences like dining, gaming, hotel stays and
much more. From acclaimed restaurants and award-winning hotels to world-class gaming and endless entertainment, Crown Rewards helps
you to discover the world of Crown – and be rewarded. Crown Towers is also
home to the exclusive Crystal Club, which offers an elevated experience for guests of the hotel.
Earn free multilevel parking when you earn 250 points or more at a
Crown hotel, restaurant or other participating outlets. Just show your Crown Rewards Card when you
pay or play and you can start earning points, which you can redeem for Crown experiences like dining, gaming, hotels stays and
much more. Home to Sydney’s newest gaming experience, top shelf bars,
oh so fine dining and next-level hotel luxury.
It is recommended that children under the age of six years old do not attend shows held
in The Palms due to noise levels. Disabled access toilets
are also located in the foyer of The Palms. Those patrons wishing to use a companion card with the booking must
be able to present the valid card at the box office upon ticket
collection. For more information, visit Ticketmaster Customer Service.
Tickets for performances purchased through an authorised outlet will be fully refunded, including fees.
Australia’s gaming enthusiasts deserve a reputable and reliable gaming environment,
and Casino Mate rises to the occasion every time. Casino Mate collaborates with some of the
most reputable game providers globally to bring you a diverse and exciting gaming library.
Our easy-to-use payment system ensures fast
transactions, allowing you to focus on what matters —
the games! Advanced encryption technologies safeguard your personal and financial information, ensuring
a worry-free gaming experience. Welcome to Casino Mate, the premier destination for
online gaming enthusiasts in Australia. With a design that seeps Australian charm, Casino Mate is an ideal
choice for players all around the world.
Moreover, the mobile website offers you an opportunity to play using any platform.
They have a choice to either stay at home and play a desktop version or go outside and enjoy
their favourite games using a mobile app. That’s why you can find mobile website versions or separate mobile apps in all
Australian online casinos. Independent auditors constantly monitor Casino-Mate pokies
and other RNG games to check if they are manipulated by the
casino’s administration or not. This type of online casino game is believed to be the most popular
in Australia. Almost all games (except live casino) are available in free mode.
For those with business at the forefront of their
stay, the Crown Towers Business Centre is available to book,
with catering options and spaces suitable for seating up to 12.
The split-level gymnasium is available exclusively to hotel guests and Crown Spa Club Members.
The 25-meter heated pool boasts luxurious day beds for relaxing, as
well as guest access to poolside refreshments at your leisure.
The AH.nl servicedesks (in selected stores) are there to provide assistance.
An easy day trip from Melbourne, Victoria’s coastal
region is located within reach of Crowne Plaza guests with
day tours and shuttles running regularly from the
Melbourne CBD. A short walk from our hotel, Southbank features some of
the city’s most popular bars and eateries. Providing a unique and immersive experience, Melbourne Zoo is home to over 320 species
from around the world. If you’d like to explore something more upbeat, Melbourne has all
the best attractions and experiences to get your heart racing.
Melbourne is the perfect destination for a fun-filled family holiday, romantic getaway, business trip, or weekend escape.
For more information on applying for Jobs and how to
set up Job Alerts, please visit our FAQ page.
Now that you have discovered the best online casinos, you can join one of our recommended casinos and dive into a thrilling experience.
Although there are some drawbacks, the benefits of playing at
online casinos are many. Some of the operators we list here also have special bonuses for mobile casino players who download and use their apps.
All online casinos approved by our team support gaming
on various devices, including smartphones and tablets. It makes
gambling online easy by allowing players to deposit money instantly.
As a result, you can start depositing money and playing casino games
almost instantly.
These are the 5 top online casinos in Canada,
each with a special highlight, from large gaming libraries and exclusive promotions to a focus on specific payment methods.
Look for casinos with 24/7 customer support, clear terms, and bonuses and promotions that will
enhance your gaming experience. To choose the right online casino,
look at factors such as licensing, game variety, and
bonuses. Start your gaming journey with confidence by choosing one of the trusted sites featured
here and enjoy the ultimate online casino experience.
Players can choose from a variety of games including online slots,
blackjack, roulette, baccarat, poker, and live dealer games.
Revpanda brings you the top online casinos after conducting thorough research using strict criteria.
Finding the top real money casinos is easy with help from Revpanda’s experienced experts in the iGaming sector.
For those who like to win, many sweeps casinos offer rewards through cash prizes,
where players can redeem Sweeps Coins for said
prizes.
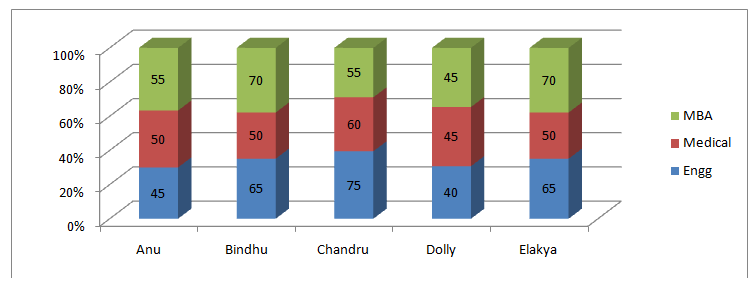
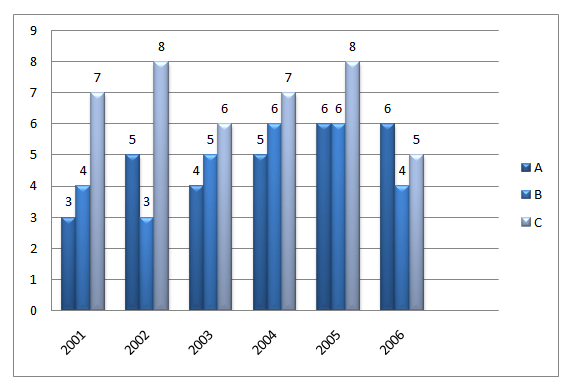
Hi
Your email address will not be published. Required fields are marked
gu =
this is rbi
A
Sir data interpretation ke question bhi hindi m dalo
Hi there, just became aware of your blog through Google, and found that it is really informative.
I’m gonna watch out for brussels. I’ll appreciate if
you continue this in future. Numerous people will be benefited from
your writing. Cheers! Escape roomy lista
Very interesting details you have remarked, thank
you for posting.!
Hello there! Do you know if they make any plugins to help with SEO?
I’m trying to get my site to rank for some targeted keywords but
I’m not seeing very good gains. If you know of any please share.
Thank you! I saw similar article here: Bij nl
Howdy! Do you know if they make any plugins to assist with Search Engine Optimization? I’m trying to get my site to rank
for some targeted keywords but I’m not seeing very good success.
If you know of any please share. Cheers! You can read similar text here:
Change your life
I’m really impressed together with your writing abilities as smartly as with the layout to your blog. Is that this a paid theme or did you modify it yourself? Anyway keep up the nice quality writing, it’s uncommon to peer a great blog like this one these days. I like gkquestionsguru.com ! It is my: Beehiiv
I’m extremely inspired along with your writing talents and also with the layout on your weblog. Is this a paid topic or did you customize it yourself? Anyway keep up the nice high quality writing, it’s rare to peer a great weblog like this one today. I like gkquestionsguru.com ! Mine is: HeyGen
биржа аккаунтов гарантия при продаже аккаунтов
аккаунт для рекламы магазин аккаунтов
продать аккаунт маркетплейс аккаунтов соцсетей
купить аккаунт с прокачкой маркетплейс аккаунтов соцсетей
аккаунт для рекламы площадка для продажи аккаунтов
аккаунт для рекламы магазин аккаунтов
магазин аккаунтов социальных сетей профиль с подписчиками
магазин аккаунтов маркетплейс аккаунтов соцсетей
площадка для продажи аккаунтов продажа аккаунтов соцсетей
маркетплейс аккаунтов https://ploshadka-prodazha-akkauntov.ru
профиль с подписчиками аккаунт для рекламы
маркетплейс аккаунтов https://kupit-akkaunt-top.ru
маркетплейс аккаунтов соцсетей гарантия при продаже аккаунтов
Account trading platform Account Acquisition
Account Store Buy Account
Accounts market Accounts marketplace
Account Trading Platform Sell Account
Account Sale Buy Pre-made Account
Website for Selling Accounts Buy accounts
Marketplace for Ready-Made Accounts Account Trading
Buy Account Social media account marketplace
Buy accounts Account Market
Account Purchase Account Trading
account selling platform account exchange service
account trading platform account market
sell accounts website for buying accounts
buy accounts account catalog
account exchange service https://accountsmarketbest.com/
sell account buy accounts
account trading buy account
account exchange service guaranteed accounts
account buying platform account purchase
database of accounts for sale account market
account purchase buy account
account buying platform account purchase
account sale ready-made accounts for sale
account store verified accounts for sale
account store buy account
purchase ready-made accounts account catalog
sell pre-made account sell pre-made account
social media account marketplace accounts market
account market guaranteed accounts
account buying platform account selling service
account marketplace marketplace for ready-made accounts
account selling service https://accounts-market-soc.org/
ready-made accounts for sale marketplace for ready-made accounts
account marketplace guaranteed accounts
accounts marketplace accounts marketplace
sell accounts sell accounts
secure account purchasing platform account exchange service
Explore the ranked best online casinos of 2025. Compare bonuses, game selections, and trustworthiness of top platforms for secure and rewarding gameplayBonus offer.
account purchase online account store
account market https://accounts-offer.org
find accounts for sale https://accounts-marketplace.xyz
account store buy accounts
account catalog account marketplace
account trading https://accounts-marketplace.live
account trading platform https://social-accounts-marketplace.xyz
database of accounts for sale https://buy-accounts.space
account buying service https://buy-accounts-shop.pro
account trading service account market
account trading https://social-accounts-marketplace.live
sell account accounts market
account exchange account marketplace
маркетплейс аккаунтов akkaunty-na-prodazhu.pro
продажа аккаунтов rynok-akkauntov.top
маркетплейс аккаунтов kupit-akkaunt.xyz
маркетплейс аккаунтов https://akkaunt-magazin.online/
продать аккаунт https://akkaunty-market.live/
площадка для продажи аккаунтов https://kupit-akkaunty-market.xyz/
маркетплейс аккаунтов https://akkaunty-optom.live/
маркетплейс аккаунтов online-akkaunty-magazin.xyz
продать аккаунт akkaunty-dlya-prodazhi.pro
магазин аккаунтов kupit-akkaunt.online
buy fb account https://buy-adsaccounts.work/
buy facebook profiles buy aged facebook ads accounts
buy accounts facebook https://buy-ad-account.top
buy fb account https://buy-ads-account.click
buy facebook profile buy aged fb account
cheap facebook advertising account https://buy-ads-account.work
facebook accounts to buy https://ad-account-for-sale.top
buy facebook accounts for advertising facebook ad account for sale
facebook ad account for sale https://ad-accounts-for-sale.work/
old google ads account for sale buy google ad threshold account
google ads reseller https://buy-ads-accounts.click
facebook ad accounts for sale https://buy-accounts.click
google ads account seller https://ads-account-for-sale.top
buy google ads threshold accounts google ads agency accounts
google ads account buy old google ads account for sale
buy google ad account https://buy-account-ads.work
buy google ads agency account https://buy-ads-agency-account.top
buy google agency account https://sell-ads-account.click
buy adwords account buy google ad threshold account
facebook business manager for sale https://buy-business-manager.org
buy google ads threshold accounts https://buy-verified-ads-account.work
facebook business manager for sale buy-bm-account.org
buy verified facebook business manager account https://buy-verified-business-manager-account.org
buy verified business manager buy-verified-business-manager.org
facebook bm buy business-manager-for-sale.org
buy business manager account buy-business-manager-verified.org
facebook business manager buy https://buy-bm.org/
verified business manager for sale https://verified-business-manager-for-sale.org/
buy facebook bm buy facebook bm account
tiktok ads account buy tiktok ad accounts
tiktok ads account buy https://tiktok-ads-account-buy.org
buy tiktok business account tiktok agency account for sale
buy tiktok ads https://tiktok-agency-account-for-sale.org
buy tiktok ads accounts https://buy-tiktok-ad-account.org
buy tiktok ads https://buy-tiktok-business-account.org
tiktok agency account for sale https://tiktok-ads-agency-account.org
tiktok agency account for sale https://buy-tiktok-ads.org
¡Hola, fanáticos del riesgo !
Casino online extranjero con juegos en vivo sin KYC – https://www.casinoextranjerosespana.es/ п»їcasinos online extranjeros
¡Que disfrutes de asombrosas botes espectaculares!
¡Saludos, estrategas del juego !
Casinos extranjeros para juegos de cartas online – https://www.casinosextranjerosenespana.es/# п»їcasinos online extranjeros
¡Que vivas increíbles jackpots extraordinarios!
¡Saludos, buscadores de tesoros!
Ranking 2025 de casinos online extranjeros top – https://www.casinosextranjerosenespana.es/# casinosextranjerosenespana.es
¡Que vivas increíbles instantes inolvidables !
¡Hola, aficionados a las apuestas!
Casino sin licencia y verificaciГіn simple – http://casinossinlicenciaespana.es/ CasinossinlicenciaEspana.es
¡Que experimentes conquistas extraordinarias !
¡Hola, buscadores de riqueza !
Casino fuera de EspaГ±a confiable y seguro – https://www.casinoonlinefueradeespanol.xyz/ casinoonlinefueradeespanol
¡Que disfrutes de asombrosas momentos memorables !
¡Hola, participantes del desafío !
casino fuera de espaГ±a con opciones flexibles – https://www.casinoonlinefueradeespanol.xyz/ casinos fuera de espaГ±a
¡Que disfrutes de asombrosas premios extraordinarios !
¡Hola, buscadores de fortuna !
Casinossinlicenciaespana.es – Acceso directo – http://casinossinlicenciaespana.es/ casino sin licencia espaГ±a
¡Que experimentes botes sorprendentes!
¡Saludos, cazadores de riquezas !
GuГa para principiantes en casino online extranjero – https://casinoextranjerosenespana.es/# casinoextranjerosenespana.es
¡Que disfrutes de triunfos épicos !
¡Saludos, aventureros del riesgo !
casinosextranjero.es – gana desde el primer giro – https://casinosextranjero.es/# casinosextranjero.es
¡Que vivas increíbles jackpots extraordinarios!
¡Saludos, apostadores apasionados !
Ranking actualizado de casinos extranjeros en 2025 – п»їhttps://casinoextranjerosenespana.es/ casino online extranjero
¡Que disfrutes de oportunidades exclusivas !
¡Saludos, amantes de la diversión !
casino online extranjero con software de calidad – https://casinosextranjero.es/# п»їcasinos online extranjeros
¡Que vivas increíbles recompensas sorprendentes !
¡Hola, usuarios de sitios de apuestas !
casinoextranjero.es – elige el mejor casino por categorГa – https://www.casinoextranjero.es/ mejores casinos online extranjeros
¡Que vivas victorias legendarias !
¡Bienvenidos, fanáticos del azar !
Casino fuera de EspaГ±a para apostadores avanzados – https://www.casinoporfuera.guru/# casino por fuera
¡Que disfrutes de maravillosas premios asombrosos !
Этот обзорный материал предоставляет информационно насыщенные данные, касающиеся актуальных тем. Мы стремимся сделать информацию доступной и структурированной, чтобы читатели могли легко ориентироваться в наших выводах. Познайте новое с нашим обзором!
Подробнее тут – https://nakroklinikatest.ru/
¡Hola, apostadores expertos !
Casino online extranjero con retiros automГЎticos – п»їhttps://casinoextranjero.es/ п»їcasinos online extranjeros
¡Que vivas recompensas fascinantes !
¡Saludos, descubridores de tesoros!
casino por fuera con sistema de puntos – https://casinosonlinefueraespanol.xyz/# casinos online fuera de espaГ±a
¡Que disfrutes de jackpots fascinantes!
¡Saludos, cazadores de suerte !
casino por fuera ideal para nuevos jugadores – https://www.casinosonlinefueraespanol.xyz/# casinosonlinefueraespanol.xyz
¡Que disfrutes de premios espectaculares !
¡Bienvenidos, exploradores de oportunidades !
Acceso directo a casino online fuera de EspaГ±a – https://casinofueraespanol.xyz/# casino por fuera
¡Que vivas increíbles botes deslumbrantes!
¡Hola, amantes del ocio y la emoción !
Top 10 casinos extranjeros con bonos de bienvenida – https://www.casinosextranjerosdeespana.es/# casinos extranjeros
¡Que vivas increíbles jugadas espectaculares !
¡Hola, exploradores del azar !
casinosextranjerosdeespana.es – accede en segundos – https://www.casinosextranjerosdeespana.es/# п»їcasinos online extranjeros
¡Que vivas increíbles jackpots sorprendentes!
¡Hola, estrategas del riesgo !
Casino por fuera con juegos tradicionales y modernos – https://casinosonlinefueradeespanol.xyz/# casinos online fuera de espaГ±a
¡Que disfrutes de asombrosas oportunidades inigualables !
¡Saludos, maestros del juego !
п»їCasinos online extranjeros con pagos rГЎpidos y seguros – https://www.casinoextranjerosdeespana.es/# п»їcasinos online extranjeros
¡Que experimentes maravillosas movidas impresionantes !
¡Saludos, fanáticos del azar !
Casino online extranjero con interfaz en espaГ±ol – https://casinoextranjerosdeespana.es/# mejores casinos online extranjeros
¡Que experimentes maravillosas momentos irrepetibles !
?Hola, cazadores de tesoros !
casino online fuera de EspaГ±a con casino en vivo – п»їhttps://casinosonlinefueradeespanol.xyz/ casinos fuera de espaГ±a
?Que disfrutes de asombrosas tiradas brillantes !
Hello champions of vitality !
Air Purifier to Remove Smoke – Smart Models – п»їhttps://bestairpurifierforcigarettesmoke.guru/ air purifier for smoke
May you experience remarkable unmatched comfort !
¡Hola, exploradores de oportunidades !
Casino sin registro con depГіsitos en criptomonedas – п»їhttps://casinosinlicenciaespana.xyz/ casino online sin licencia espaГ±a
¡Que vivas increíbles giros exitosos !
¡Hola, amantes del ocio y la emoción !
Casinos sin licencia en Espana que permiten jugar anГіnimo – https://casinosinlicenciaespana.xyz/# casino online sin licencia
¡Que vivas increíbles instantes únicos !
¡Bienvenidos, jugadores hábiles !
Casinos sin registro que aceptan Bitcoin – п»їmejores-casinosespana.es Mejores-CasinosEspana.es
¡Que experimentes maravillosas triunfos legendarios !
¡Saludos, maestros del juego !
Casino sin licencia para jugar sin restricciones – п»їaudio-factory.es audio-factory.es
¡Que disfrutes de asombrosas momentos irrepetibles !
¡Saludos, cazadores de recompensas únicas!
Casino sin licencia para usuarios anГіnimos – https://www.audio-factory.es/ casino sin licencia espaГ±ola
¡Que disfrutes de asombrosas momentos irrepetibles !
¡Bienvenidos, buscadores de fortuna secreta !
Casino online sin licencia EspaГ±a sin KYC – http://mejores-casinosespana.es/ casino online sin registro
¡Que experimentes maravillosas momentos inolvidables !
¡Saludos, seguidores de la adrenalina !
Casino sin licencia EspaГ±a sin intervenciГіn externa – https://emausong.es/ casino online sin licencia
¡Que disfrutes de increíbles victorias épicas !
¡Saludos, exploradores de posibilidades únicas !
Casinos con bono de bienvenida al instante – http://bono.sindepositoespana.guru/# casino online con bono de bienvenida
¡Que disfrutes de asombrosas momentos irrepetibles !
Greetings, discoverers of secret humor !
Joke of the day for adults – keep smiling – http://jokesforadults.guru/# best jokes adult
May you enjoy incredible unique witticisms !
¡Saludos, estrategas del juego !
Casino bono de bienvenida sin tarjeta bancaria – https://bono.sindepositoespana.guru/ casino regalo bienvenida
¡Que disfrutes de asombrosas botes sorprendentes!
Greetings, lovers of jokes and good humor !
Funny adult jokes to send your best friend – п»їhttps://jokesforadults.guru/ 1,000 dirty jokes in english
May you enjoy incredible side-splitting jokes !
Hello initiators of serene environments !
Smokers who live with others often rely on the best air purifier for smokers to minimize exposure. It’s especially effective in homes with children or elderly residents. The best air purifier for smokers reduces the risks of secondhand smoke.
A dedicated smoke purifier is crucial for rooms where smoking occurs regularly. It prevents the spread of harmful pollutants. air purifier for smoke Keeping these spaces fresh enhances comfort and health.
Air filter for smoke with quick purification – п»їhttps://www.youtube.com/watch?v=fJrxQEd44JM
May you delight in extraordinary exceptional cleanness !
facebook account sale account market account purchase
buy a facebook ad account account selling platform account trading service
¿Saludos jugadores entusiastas
Los mejores casinos en lГnea de Europa cuentan con plataformas multilingГјes que incluyen soporte en espaГ±ol, inglГ©s, alemГЎn y mГЎs. casinos online europeos Esto facilita el acceso a usuarios de diferentes paГses con la misma calidad de servicio. La experiencia de usuario es uniforme y profesional.
Algunos casinos europeos ofrecen juegos exclusivos que no encontrarГЎs en otros continentes. Esta originalidad es uno de los puntos fuertes del casino online Europa. Las alianzas con estudios pequeГ±os traen sorpresas constantes.
Casino Europa sin comisiones en retiros bancarios – п»їhttps://casinosonlineeuropeos.guru/
¡Que disfrutes de grandes triunfos !
¿Saludos amantes del azar
Los mejores casinos europeos permiten invitar amigos con enlaces personalizados que otorgan recompensas a ambos. Es una forma de crecer la comunidad. casinos europeos Jugar en grupo tambiГ©n tiene ventajas.
Casino Europa ha invertido en seguridad digital, encriptando todas las transacciones que realiza el usuario. Este casino europeo tambiГ©n tiene verificaciГіn en dos pasos para proteger tus fondos. La ciberseguridad es una prioridad para todos los casinos europeos.
Casinosonlineeuropeos con app para iOS y Android – п»їhttps://casinosonlineeuropeos.guru/
¡Que disfrutes de grandes jackpots!
¿Hola seguidores del juego ?
Los bonos sin rollover son comunes en casas de apuestas fuera de EspaГ±a, lo que permite retirar sin cumplir requisitos abusivos.apuestas fuera de espaГ±aEso convierte la experiencia en algo mГЎs rentable desde el inicio.
Algunas casas de apuestas extranjeras ofrecen acceso anticipado a nuevas slots o versiones beta. Esto te permite jugar antes que en plataformas tradicionales. Y muchas veces, sin necesidad de depГіsito inicial.
Apuestas fuera de espaГ±a: plataformas recomendadas para jugadores – п»їhttps://casasdeapuestasfueradeespana.guru/
¡Que disfrutes de enormes ventajas !
Greetings to all thrill gamblers !
Bettors who use 1xbetregistrationinnigeria.com can take advantage of combo bet bonuses. Nigerian players also get access to weekly leaderboards. 1xbet registration nigeria All promotions at 1xbetregistrationinnigeria.com are updated regularly.
With 1xbet nigeria registration, users can activate their accounts using a promo code for extra rewards. The registration form is available in English, Hausa, and Yoruba. Local bank options make 1xbet nigeria registration even more convenient.
Verified signups through 1xbet ng registration form – п»їhttps://1xbetregistrationinnigeria.com/
Hope you enjoy amazing rounds !
Kind regards to all excitement fans !
The “One-Click Bet” feature is available on 1xbet-login-nigeria.com for the fastest possible gameplay. Activate it to place bets with a pre-set amount with a single click. https://1xbet-login-nigeria.com/ This is especially useful for real-time betting.
The 1xbet nigeria registration online process is protected by an SSL protocol, which guarantees the confidentiality of your data. All the information you provide is securely encrypted. Your security is the company’s top priority.
1xbet ng login registration online | Mobile Entry – п»їhttps://1xbet-login-nigeria.com/
Wishing you incredible turns !
?Mis calidos augurios para todos los adoradores de la emocion !
Los mejores casinos online ofrecen soporte en mГєltiples idiomas. casino online europeo Un casino online europeo se adapta a jugadores nuevos y experimentados. Los mejores casinos online ofrecen jackpots progresivos.
El casino europa cuenta con mesas de pГіker y apuestas deportivas. En casinoonlineeuropeo.blogspot.com puedes encontrar comparativas Гєtiles. Un casino online europa estГЎ optimizado para mГіviles.
CГіmo ganar en un euro casino online: trucos y guГas – п»їhttps://casinoonlineeuropeo.blogspot.com/
?Que goces de excepcionales ganancias !
п»їcasinos online europeos
?Mis calidos augurios para todos los socios incondicionales del casino !
Un casino online europa ofrece juegos de ruleta, blackjack y tragaperras. El casino europa dispone de torneos con premios atractivos. Un euro casino online brinda promociones diarias y giros gratis.
Un euro casino online permite apostar en varias monedas. Los casinos europeos aceptan mГ©todos de pago tradicionales y modernos. Un euro casino online combina diversiГіn y seguridad.
Elige los casinos europeos – п»їhttps://casinoonlineeuropeo.blogspot.com/
?Que goces de excepcionales victorias !
casinos europeos
Abnormal this put up is totaly unrelated to what I was searching google for, but it surely used to be listed at the first page. I suppose your doing one thing proper if Google likes you adequate to place you at the first page of a non similar search.
Im impressed. I dont think Ive met anyone who knows as much about this subject as you do. Youre truly well informed and very intelligent. You wrote something that people could understand and made the subject intriguing for everyone. Really, great blog youve got here.
I think that may be an interesting element, it made me assume a bit. Thanks for sparking my considering cap. On occasion I get so much in a rut that I simply really feel like a record.
It’s the best time to make some plans for the future and it is time to be happy. I’ve read this post and if I could I wish to suggest you some interesting things or tips. Maybe you can write next articles referring to this article. I wish to read even more things about it!
of course like your web-site however you have to check the spelling on several of your posts. Many of them are rife with spelling problems and I find it very troublesome to tell the reality then again I will surely come back again.
Hi, possibly i’m being a little off topic here, but I was browsing your site and it looks stimulating. I’m writing a blog and trying to make it look neat, but everytime I touch it I mess something up. Did you design the blog yourself?
Surprisingly good post. I really found your primary webpage and additionally wanted to suggest that have essentially enjoyed searching your website blog posts. Whatever the case I’ll always be subscribing to your entire supply and I hope you jot down ever again soon!
Great blog here! Additionally your website rather a lot up very fast! What host are you the usage of? Can I get your associate link for your host? I desire my website loaded up as fast as yours lol
Envio mis saludos a todos los buscadores de riquezas !
Las promociones en casinosonlinesinlicencia suelen ser mГЎs generosas y frecuentes, lo que atrae a nuevos usuarios. Muchos jugadores eligen casinosonlinesinlicencia porque ofrece mГЎs libertad y anonimato que los sitios regulados. El acceso a casinosonlinesinlicencia es posible desde cualquier dispositivo sin necesidad de descargas.
Algunos usuarios prefieren casino sin registro ya que aceptan criptomonedas y mГ©todos de pago modernos. Las promociones en casino sin registro suelen ser mГЎs generosas y frecuentes, lo que atrae a nuevos usuarios. ВїQuieres apostar sin lГmites? casino sin registro te permite jugar con depГіsitos y retiros flexibles.
Explora casinos no regulados con acceso inmediato – п»їhttps://casinosonlinesinlicencia.xyz/
Que disfrutes de increibles victorias !
casinos sin licencia en EspaГ±ola
Envio mis saludos a todos los companeros fieles del juego !
Las plataformas de casinos fuera de espaГ±a ofrecen mГ©todos de pago modernos y retiros instantГЎneos. Gracias a casino fuera de espaГ±a los jugadores pueden acceder a promociones especiales y giros gratis. . La experiencia en casino por fuera se caracteriza por retiros sin comisiones y depГіsitos flexibles.
Los usuarios destacan que casino online fuera de espaГ±a permite apuestas en vivo con menor latencia. En casinosfueradeespana.blogspot.com los usuarios encuentran juegos Гєnicos que no aparecen en sitios regulados. La experiencia en casino online fuera de espaГ±a se caracteriza por retiros sin comisiones y depГіsitos flexibles.
casinosfueradeespana con bonos sin depГіsito – п»їhttps://casinosfueradeespana.blogspot.com/
Que disfrutes de increibles partidas !
п»їп»їcasino fuera de espaГ±a
Just came from google to your website have to say thanks.
I loved your idea there, I tell you blogs are so exciting sometimes like looking into people’s private life’s and work. Every new remark wonderful in its own right.
Public policy is key here, and our states need to develop some strategies – – soon.
Wish I’d thought of this. Am in the field, but I procrastinate alot and haven’t written as much as I’d like. Thanks.
You are one talented writer thank you for the post.
Thanks for posting this. Looking for these resources 😀
Saludo cordialmente a todos los apostadores expertos !
Las corredores de apuestas ofrecen a los jugadores espaГ±oles mГЎs libertad que las reguladas. Muchos usuarios eligen corredores de apuestas porque permiten mejores cuotas y mГЎs promociones. AdemГЎs, registrarse en corredores de apuestas suele ser rГЎpido y sencillo.
Las corredores de apuestas ofrecen a los jugadores espaГ±oles mГЎs libertad que las reguladas. Muchos usuarios eligen corredores de apuestas porque permiten mejores cuotas y mГЎs promociones. AdemГЎs, registrarse en corredores de apuestas suele ser rГЎpido y sencillo.
casas de apuestas sin verificacion con promociones y mercados internac – п»їhttps://casasdeapuestasextranjeras.xyz/
Ojala disfrutes de increibles jackpots!
casasdeapuestasextranjeras
Great blog here! Additionally your website rather a lot up very fast! What host are you the usage of? Can I get your associate link for your host? I desire my website loaded up as fast as yours lol
Amazing content on your website.
I discovered your weblog site on google and verify just a few of your early posts. Proceed to maintain up the very good operate. I simply further up your RSS feed to my MSN News Reader.
Tham gia game Luck8 ngay! Cá cược đỉnh cao, nổ thưởng khủng, giao dịch siêu tốc. Nhà cái uy tín, trải nghiệm mãn nhãn cùng ưu đãi siêu hời!
How long does it take you to write an article like this?
I’ve thought about posting something about this before. Good job! Can I use part of your post in my blog?
Saludo cordialmente a todos los exploradores del azar!
Los jugadores pueden aprovechar giros gratis sin depГіsito EspaГ±a para comenzar a jugar sin riesgo. Muchos operadores ofrecen 50 tiradas gratis como parte de su bienvenida. AdemГЎs, en sitios como spins gratis sin depГіsito EspaГ±a encuentras promociones actualizadas cada dГa.
Los jugadores pueden aprovechar spins gratis sin depГіsito EspaГ±a para comenzar a jugar sin riesgo. Muchos operadores ofrecen 50girosgratissindeposito.xyz como parte de su bienvenida. AdemГЎs, en sitios como 50 giros gratis encuentras promociones actualizadas cada dГa.
RegГstrate hoy y recibe casino 50 tiradas gratis fГЎcil – п»їhttps://50girosgratissindeposito.xyz/
Deseo que vivas increibles encuentros !
50 giros gratis
I came across an article that talks about the same thing but even more and when you go deeper.
Great blog here! Also your site loads up very fast! What web host are you using? Can I get your affiliate link to your host? I wish my website loaded up as fast as yours lol
Hey very cool site!! Man .. Beautiful .. Amazing .. I will bookmark your website and take the feeds also…I’m happy to find so many useful information here in the post, we need develop more strategies in this regard, thanks for sharing. . . . . .
HBet – Cổng giải trí trực tuyến hàng đầu, quy tụ hàng ngàn trò chơi cá cược thể thao, casino, slot game và bắn cá đổi thưởng. Giao diện mượt mà, bảo mật tuyệt …
HBet – Cổng giải trí trực tuyến hàng đầu, quy tụ hàng ngàn trò chơi cá cược thể thao, casino, slot game và bắn cá đổi thưởng. Giao diện mượt mà, bảo mật tuyệt …
HBet – Cổng giải trí trực tuyến hàng đầu, quy tụ hàng ngàn trò chơi cá cược thể thao, casino, slot game và bắn cá đổi thưởng. Giao diện mượt mà, bảo mật tuyệt …
HBet – Cổng giải trí trực tuyến hàng đầu, quy tụ hàng ngàn trò chơi cá cược thể thao, casino, slot game và bắn cá đổi thưởng. Giao diện mượt mà, bảo mật tuyệt …
A cool post there mate ! Thank you for posting.
I came across an article that talks about the same thing but even more and when you go deeper.
This is one very informative blog. I like the way you write and I will bookmark your blog to my favorites.
What i discover troublesome is to find a weblog that may capture me for a minute however your blog is different. Bravo.
Transform your interiors with copper effect tiles, the perfect blend of style and durability. Our copper effect bathroom tiles bring spa-like warmth and elegance to wet areas, while the robust copper effect floor tiles add an industrial yet luxurious touch to living spaces. Crafted from premium porcelain, these copper look porcelain tiles capture the rich, oxidised beauty of real metal with all the benefits of easy maintenance, stain resistance, and long-lasting performance. Available in a striking 60×120 copper floor tiles format, they create a seamless, contemporary look with minimal grout lines, making them an ideal choice for modern homes and commercial projects alike.
I have to disagree with most of the comments here, but maybe I’m just a contrarian.
Thanks for posting this. Looking for these resources 😀
You appear to know so much about this, and I see you’re a published author. Thanks
it is a really nice point of view. I usually meet people who rather say what they suppose others want to hear. Good and well written! I will come back to your site for sure!
You have some helpful ideas! Maybe I should consider doing this by myself.
fantastic internet site, I could definitely go to your web page once more…acquired some really nice info.
mm88 là sân chơi cá cược đẳng cấp hàng đầu Châu Á. Sở hữu kho game trực tuyến đa dạng từ: xổ số, casino, thể thao,… Tải App để tham gia trải nghiệm mượt …
mm88 là sân chơi cá cược đẳng cấp hàng đầu Châu Á. Sở hữu kho game trực tuyến đa dạng từ: xổ số, casino, thể thao,… Tải App để tham gia trải nghiệm mượt …
mm88 là sân chơi cá cược đẳng cấp hàng đầu Châu Á. Sở hữu kho game trực tuyến đa dạng từ: xổ số, casino, thể thao,… Tải App để tham gia trải nghiệm mượt …
A wholly agreeable point of view, I think primarily based on my own experience with this that your points are well made, and your analysis on target.
Excellent read, I just passed this onto a colleague who was doing a little research on that. And he actually bought me lunch because I found it for him smile So let me rephrase that.|
Substantially, the post is really the best on this laudable topic. I concur with your conclusions and will eagerly watch forward to your future updates.Just saying thanx will not just be enough, for the wonderful lucidity in your writing.
Pretty impressive article. I just stumbled upon your site and wanted to say that I have really enjoyed reading your opinions. Any way I’ll be coming back and I hope you post again soon.
Oh my goodness! an amazing article. Great work.
These are some of the most important issues we’ll face over the next few decades.
Regards for helping out, superb info.
Thanks a bunch for sharing this with all people you really recognize what you are talking about! Bookmarked. Kindly also seek advice from my web site =). We can have a link alternate contract between us!
Thank you for all the information was very accurate, just wondering if all this is possible.~
This is one very informative blog. I like the way you write and I will bookmark your blog to my favorites.
Only a smiling visitor here to share the love (:, btw outstanding style and design .
What a great article.. i subscribed btw!
I like this weblog very much so much great info .
The clarity in your post is just nice and I can tell you are an expert in the subject matter.
Warm greetings to all the casino players !
The entertainment at casino live never stops and keeps evolving. live casino online Secure transactions are guaranteed at casino live The interaction with other players makes casino live more exciting.
Secure transactions are guaranteed at livecasinogreece. With livecasinogreece, you can play roulette, blackjack, and poker in real time. Professional dealers at livecasinogreece make the experience realistic.
Play and Win at casino live – Real Games Anytime – п»їhttps://livecasinogreece.guru/
I wish you amazing winnings !
ОєО±О¶О№ОЅОї live
This article actually helped me with a report I was doing.
Im impressed. I dont think Ive met anyone who knows as much about this subject as you do. Youre truly well informed and very intelligent. You wrote something that people could understand and made the subject intriguing for everyone. Really, great blog youve got here.
Hi, I just hopped over to your web-site through StumbleUpon. Not somthing I might typically browse, but I liked your views none the less. Thanks for making something worthy of reading through.
I would really like to appreciate the endeavors you cash in on written this article. I’m going for the similar best product from you finding out in the foreseeable future as well. Actually your creative writing abilities has urged me to begin my very own blog now. Genuinely the blogging is distributing its wings rapidly. Your write down is often a fine illustration showing it.
?Saludos cordiales a todos los fanaticos de las tragaperras !
Muchos jugadores confГan en libra bet porque ofrece opciones seguras y variadas. librabet casino Con libra bet se puede acceder fГЎcilmente a promociones exclusivas y mГ©todos de pago modernos. AdemГЎs, libra bet garantiza una experiencia de usuario fluida en cualquier dispositivo.
Muchos jugadores confГan en librabet app apk porque ofrece opciones seguras y variadas. Con librabet app apk se puede acceder fГЎcilmente a promociones exclusivas y mГ©todos de pago modernos. AdemГЎs, librabet app apk garantiza una experiencia de usuario fluida en cualquier dispositivo.
CГіmo registrarse y jugar en librabet apk fГЎcilmente – п»їhttps://librabetcasino.guru/#
?Te deseo increibles giros !
librabet app android
Glad to be one of several visitors on this awful internet site : D.
Spot on with this write-up, I truly believe this website requirements a lot much more consideration. I’ll probably be once more to read much much more, thanks for that info.
If most people wrote about this subject with the eloquence that you just did, I’m sure people would do much more than just read, they act. Great stuff here. Please keep it up.
?Saludos cordiales a todos los jugadores de casino !
Muchos jugadores confГan en librabet bonus porque ofrece opciones seguras y variadas. Con librabet bonus se puede acceder fГЎcilmente a promociones exclusivas y mГ©todos de pago modernos. AdemГЎs, librabet bonus garantiza una experiencia de usuario fluida en cualquier dispositivo.
Muchos jugadores confГan en librabet anmeldelse porque ofrece opciones seguras y variadas. Con librabet anmeldelse se puede acceder fГЎcilmente a promociones exclusivas y mГ©todos de pago modernos. AdemГЎs, librabet anmeldelse garantiza una experiencia de usuario fluida en cualquier dispositivo.
Descubre bonos y ventajas en librabet ahora – п»їhttps://librabetcasino.guru/#
?Te deseo increibles recompensas !
librabet espaГ±a
These stories are so important.
XOSO66 là nền tảng xổ số trực tuyến quốc tế, ra đời với sứ mệnh mang đến cho người chơi một môi trường giải trí minh bạch, công bằng và hiện đại.
Gemwin game bài đại phú quý cung cấp trải nghiệm giải trí trên Web, Android và iOS. Đăng ký, tải Gem win nhận nhiều ưu đãi khủng.
Thank you for the auspicious writeup.
Howdy I wanted to write a new remark on this page for you to be able to tell you just how much i actually Enjoyed reading this read. I have to run off to work but want to leave ya a simple comment. I saved you So will be returning following work in order to go through more of yer quality posts. Keep up the good work.
Good job for bringing something important to the internet!
Do you offer workshops?
You are good writer. Thank you.
Hey, I simply hopped over to your website by way of StumbleUpon. No longer one thing I’d normally learn, but I preferred your thoughts none the less. Thanks for making one thing worth reading.
Just want to say what a great blog you got here!I’ve been around for quite a lot of time, but finally decided to show my appreciation of your work!
I have been surfing online more than three hours today, yet I never found anything that grabbed my interest as much as this piece.
I just sent this post to a bunch of my friends as I agree with most of what you’re saying here and the way you’ve presented it is awesome.
I have to disagree with most of the comments here, but maybe I’m just a contrarian.
?Warm greetings to all the casino players !
Players looking for exciting offers often choose bonus no deposit because it provides easy access to rewards. Many international platforms highlight no deposit bonus casino greece to attract new members and increase engagement. The popularity of such promotions continues to grow as gamblers search for the best deals in the market.
Players looking for exciting offers often choose no deposit bonus greece because it provides easy access to rewards. Many international platforms highlight nodepositbonusgreece to attract new members and increase engagement. The popularity of such promotions continues to grow as gamblers search for the best deals in the market.
Top no deposit bonus greece deals you should not miss this year – п»їhttps://nodepositbonusgreece.guru/
?I wish you incredible jackpots!
no deposit casino
I am glad to be a visitor of this thoroughgoing web blog ! , regards for this rare information! .
I concur with your conclusions and will eagerly look forward to your future updates. The usefulness and significance is overwhelming and has been invaluable to me!
Thanks for posting this. Looking for these resources 😀
Spot on with this write-up, I actually assume this website needs far more consideration. I will in all probability be once more to learn rather more, thanks for that info.
I really believe you will do well in the future I appreciate everything you have added to my knowledge base.
Hiya, I am really glad I have found this information. Nowadays bloggers publish only about gossip and net stuff and this is actually frustrating.
Of course, what a great site and informative posts, I will add backlink – bookmark this site? Regards, Reader
Dude.. I am not much into reading, but somehow I got to read lots of articles on your blog. Its amazing how interesting it is for me to visit you very often. –
I wrote down your blog in my bookmark. I hope that it somehow did not fall and continues to be a great place for reading texts.
Some truly interesting info , well written and broadly user genial .
Nice blog here! Also your web site loads up very fast! What host are you using? Can I get your affiliate link to your host? I wish my web site loaded up as fast as yours lol
Hello there, just became aware of your blog through Google, and found that it is truly informative. I am going to watch out for brussels. I will appreciate if you continue this in future. Lots of people will be benefited from your writing. Cheers!
Good day! This is my first comment here so I just wanted to give a quick shout out and say I really enjoy reading through your articles. Can you recommend any other blogs/websites/forums that cover the same subjects? Thanks a lot!
Assume you are doing good linking to position you on the first pages of search engines.
Sweet blog! I found it while browsing on Yahoo News. Do you have any tips on how to get listed in Yahoo News? I’ve been trying for a while but I never seem to get there! Thank you
I have been surfing online more than three hours today, yet I never found anything that grabbed my interest as much as this piece.
I enjoy your blog posts, saved to my bookmarks!
Wish I’d thought of this. Am in the field, but I procrastinate alot and haven’t written as much as I’d like. Thanks.
Most often since i look for a blog Document realize that the vast majority of blog pages happen to be amateurish. Not so,We can honestly claim for which you writen is definitely great and then your webpage rock solid.
If you don’t mind, where do you host your weblog? I am looking for a very good web host and your webpage seams to be extremely fast and up most the time…
?Warm greetings to all the roulette companions !
Ethical analyses of crypto-enabled gaming platforms assess potential harms and benefits. betting without identificationThese papers stress harm reduction and informed consent. Academia recommends clear disclosure and robust safeguards.
Policy briefs that reference crypto-enabled gaming platforms discuss mitigation strategies. They outline steps to protect users while enabling research. Balanced policy proposals are preferred by most analysts.
ПѓП„ОїО№П‡О·ОјО±П„О№ОєО· П‡П‰ПЃО№Пѓ П„О±П…П„ОїПЂОїО№О·ПѓО·: legal issues and warnings – п»їhttps://bettingwithoutidentification.xyz/#
?I wish you incredible encounters !
ПѓП„ОїО№П‡О·ОјО±П„О№ОєОµП‚ П‡П‰ПЃО№П‚ П„О±П…П„ОїПЂОїО№О·ПѓО·
Hi, possibly i’m being a little off topic here, but I was browsing your site and it looks stimulating. I’m writing a blog and trying to make it look neat, but everytime I touch it I mess something up. Did you design the blog yourself?
?Warm greetings to all the poker masters !
secure anonymous gaming interfaces are being studied by researchers who examine user privacy practices. This research highlights usability and security trade-offs. Regulators and academics continue to monitor these developments.
Technical reviews of research on gaming privacy analyze how identity data is minimized. These reviews prioritize transparency and security considerations. Stakeholders urge measured oversight rather than blanket assumptions.
ПѓП„ОїО№П‡О·ОјО±П„О№ОєОµПѓ П‡П‰ПЃО№Пѓ П„О±П…П„ОїПЂОїО№О·ПѓО· — overview and risks – п»їhttps://bettingwithoutidentification.xyz/#
?I wish you incredible jackpots!
bettingwithoutidentification.xyz
Thank you a lot for sharing this with all folks you actually recognize what you’re speaking about! Bookmarked. Please additionally visit my site =). We can have a hyperlink trade contract among us!
I like your blog. It sounds every informative.
Hi, do have a e-newsletter? In the event you don’t definately should get on that piece…this web site is pure gold!
A warm greeting to all the treasure seekers !
Sites that feature no deposit bonus casino greece usually combine security, variety, and instant accessibility for users. One of the biggest advantages of choosing no deposit bonus casino greece is that it allows players to test games without initial investment. . Players looking for no deposit bonus casino greece can find exciting opportunities on various platforms that cater to Greek audiences.
Gamers often recommend checking free spins no deposit Greece when comparing bonuses across different casinos in Greece. Many sites now highlight free spins no deposit Greece, giving users more chances to enjoy slots and table games risk-free. Whether you prefer slots or live dealer games, free spins no deposit Greece gives you a way to start playing instantly.
Your Guide to Finding bonus no deposit Safely – п»їhttps://nodepositbonusgreece.xyz/#
May you have the fortune to enjoy incredible jackpots!
no deposit casino
Easily, the post is really the greatest on this laudable topic. I concur with your conclusions and will thirstily look forward to your future updates. Saying thank will not just be sufficient, for the wonderful c lucidity in your writing. I will instantly grab your rss feed to stay privy of any updates. Solid work and much success in your business enterprise!
Its just like you read my thoughts! It’s like reading about my family.
I just added your web site to my blogroll, I hope you would look at doing the same.
Spot on with this write-up, I actually assume this website needs far more consideration. I will in all probability be once more to learn rather more, thanks for that info.
Thank you for all the information was very accurate, just wondering if all this is possible.~
When are you going to post again? You really entertain me!
If you are looking to post free classifieds in India online, we highly recommend Xpdea Classifieds. Xpdea is India’s leading free online ads posting site.
If you are looking to post free classifieds in India online, we highly recommend Xpdea Classifieds. Xpdea is India’s leading free online ads posting site.
Nice post.Very useful info specifically the last part 🙂 Thank you and good luck.
The sketch is tasteful, your authored material stylish.
This blog post is excellent, probably because of how well the subject was developed. I like some of the comments too though I could prefer we all stay on the subject in order add value to the subject!
Does it look like we’re in for a big ride here?
Most often since i look for a blog Document realize that the vast majority of blog pages happen to be amateurish. Not so,We can honestly claim for which you writen is definitely great and then your webpage rock solid.
I appreciate your work, thanks for all the great blog posts.
Im impressed. I dont think Ive met anyone who knows as much about this subject as you do. Youre truly well informed and very intelligent. You wrote something that people could understand and made the subject intriguing for everyone. Really, great blog youve got here.
Great blog right here! You seem to put a significant amount of material on the site rather quickly.
When we look at these issues, we know that they are the key ones for our time.
There most be a solution for this problem, some people think there will be now solutions, but i think there wil be one.
I really love this article.
Hello.This article was extremely interesting, particularly since I was searching for thoughts on this subject last couple of days.
Cheers to every reward chasers !
Players who love Mediterranean style and excitement often choose casinoonlinegreek for its vibrant atmosphere and authentic games. greek casino onlineAt casino greek online, you can explore hundreds of slots, live dealers, and bonuses inspired by Greek culture. This casinoonlinegreek destination combines ancient myths with modern gaming technology, creating an unforgettable experience.
Players who love Mediterranean style and excitement often choose greek online casino for its vibrant atmosphere and authentic games. At casino online greek, you can explore hundreds of slots, live dealers, and bonuses inspired by Greek culture. This greek online casino destination combines ancient myths with modern gaming technology, creating an unforgettable experience.
Join casino greek online and Experience Real Casino Excitement – п»їhttps://casinoonlinegreek.com/
May you have the fortune to enjoy incredible Wishing you thrilling benefits !
Most often since i look for a blog Document realize that the vast majority of blog pages happen to be amateurish. Not so,We can honestly claim for which you writen is definitely great and then your webpage rock solid.
I discovered your weblog site on google and verify just a few of your early posts. Proceed to maintain up the very good operate. I simply further up your RSS feed to my MSN News Reader.
I thought it was going to be some boring old post, but I’m glad I visited. I will post a link to this site on my blog. I am sure my visitors will find that very useful.
Amazing! Your site has quite a few comment posts. How did you get all of these bloggers to look at your site I’m envious! I’m still studying all about posting articles on the net. I’m going to view pages on your website to get a better understanding how to attract more people. Thank you!
The clarity in your post is just nice and I can tell you are an expert in the subject matter.
There is so much to try to understand
Good post. I study something more difficult on different blogs everyday. It’s going to always be stimulating to learn content material from other writers and observe a little bit one thing from their store. I’d prefer to use some with the content material on my blog whether you don’t mind. Natually I’ll give you a link in your web blog. Thanks for sharing.
VIPWin nhà cái cá cược trực tuyến top 1 Châu Á, nơi cung cấp kho game đa dạng với tỷ lệ cược hấp dẫn, dịch vụ khách hàng tận tâm.
Γεια χαρά σε όλους! Εδώ είμαστε πάλι, η ομάδα των ειδικών, για να βουτήξουμε σε ένα θέμα που καίει πολλούς παίκτες στην Ελλάδα: ποιές ξένες στοιχηματικές εταιρίες δέχονται τους παίκτες από την χώρα μας ελεύθερα, χωρίς VPN και γρήγορες πληρωμές; Έχουμε περάσει ώρες ατελείωτες δοκιμάζοντας διάφορες πλατφόρμες τζόγου, διαβάζοντας ψιλά γράμματα και μιλώντας με ομάδα υποστήριξης, για να σας δώσουμε την ξεκάθαρη εικόνα για το τι παίζει σε αυτές τις πλατφόρμες πραγματικά.
Τα online καζίνο αποτελούν σήμερα μια από τις πιο δημοφιλείς μορφές ψυχαγωγίας στην Ελλάδα. Η αγάπη των Ελλήνων παικτών για αυτή τη μορφή διασκέδασης μεγαλώνει συνεχώς, και μαζί με αυτή την αύξηση, πολλαπλασιάζονται και οι επιλογές σε διαδικτυακά καζίνο. Αν θέλεις να βρεις τα καλύτερα και πιο ασφαλή καζίνο για να παίξεις, είναι σημαντικό να ξέρεις πώς να ξεχωρίζεις τις αξιόπιστες πλατφόρμες από τις υπόλοιπες. Στο παρακάτω άρθρο θα βρεις χρήσιμες πληροφορίες και συμβουλές για να κάνεις την καλύτερη επιλογή και να απολαύσεις το παιχνίδι με ασφάλεια και διασκέδαση.
Τα online καζίνο αποτελούν σήμερα μια από τις πιο δημοφιλείς μορφές ψυχαγωγίας στην Ελλάδα. Η αγάπη των Ελλήνων παικτών για αυτή τη μορφή διασκέδασης μεγαλώνει συνεχώς, και μαζί με αυτή την αύξηση, πολλαπλασιάζονται και οι επιλογές σε διαδικτυακά καζίνο. Αν θέλεις να βρεις τα καλύτερα και πιο ασφαλή καζίνο για να παίξεις, είναι σημαντικό να ξέρεις πώς να ξεχωρίζεις τις αξιόπιστες πλατφόρμες από τις υπόλοιπες. Στο παρακάτω άρθρο θα βρεις χρήσιμες πληροφορίες και συμβουλές για να κάνεις την καλύτερη επιλογή και να απολαύσεις το παιχνίδι με ασφάλεια και διασκέδαση.
Τα online καζίνο αποτελούν σήμερα μια από τις πιο δημοφιλείς μορφές ψυχαγωγίας στην Ελλάδα. Η αγάπη των Ελλήνων παικτών για αυτή τη μορφή διασκέδασης μεγαλώνει συνεχώς, και μαζί με αυτή την αύξηση, πολλαπλασιάζονται και οι επιλογές σε διαδικτυακά καζίνο. Αν θέλεις να βρεις τα καλύτερα και πιο ασφαλή καζίνο για να παίξεις, είναι σημαντικό να ξέρεις πώς να ξεχωρίζεις τις αξιόπιστες πλατφόρμες από τις υπόλοιπες. Στο παρακάτω άρθρο θα βρεις χρήσιμες πληροφορίες και συμβουλές για να κάνεις την καλύτερη επιλογή και να απολαύσεις το παιχνίδι με ασφάλεια και διασκέδαση.
Γεια χαρά σε όλους! Εδώ είμαστε πάλι, η ομάδα των ειδικών, για να βουτήξουμε σε ένα θέμα που καίει πολλούς παίκτες στην Ελλάδα: ποιές ξένες στοιχηματικές εταιρίες δέχονται τους παίκτες από την χώρα μας ελεύθερα, χωρίς VPN και γρήγορες πληρωμές; Έχουμε περάσει ώρες ατελείωτες δοκιμάζοντας διάφορες πλατφόρμες τζόγου, διαβάζοντας ψιλά γράμματα και μιλώντας με ομάδα υποστήριξης, για να σας δώσουμε την ξεκάθαρη εικόνα για το τι παίζει σε αυτές τις πλατφόρμες πραγματικά.
Γεια χαρά σε όλους! Εδώ είμαστε πάλι, η ομάδα των ειδικών, για να βουτήξουμε σε ένα θέμα που καίει πολλούς παίκτες στην Ελλάδα: ποιές ξένες στοιχηματικές εταιρίες δέχονται τους παίκτες από την χώρα μας ελεύθερα, χωρίς VPN και γρήγορες πληρωμές; Έχουμε περάσει ώρες ατελείωτες δοκιμάζοντας διάφορες πλατφόρμες τζόγου, διαβάζοντας ψιλά γράμματα και μιλώντας με ομάδα υποστήριξης, για να σας δώσουμε την ξεκάθαρη εικόνα για το τι παίζει σε αυτές τις πλατφόρμες πραγματικά.
I do not even know how I ended up here, but I thought this post was good. I do not know who you are but certainly you are going to a famous blogger if you are not already 😉 Cheers!
Advanced reading here!
I like your style!
I don’t know if it’s just me or if everybody else experiencing issues with your site. It appears as though some of the written text on your content are running off the screen. Can someone else please provide feedback and let me know if this is happening to them as well? This could be a problem with my web browser because I’ve had this happen before. Appreciate it
?Calidos saludos a todos los companeros de ruleta !
El reciclaje de dispositivos electrГіnicos debe incluir el borrado de datos. Dejar informaciГіn almacenada puede ser peligroso. casinos sin dni Formatear correctamente es una prГЎctica necesaria.
La ingenierГa social manipula a las personas para obtener informaciГіn. La mejor defensa es la desconfianza ante solicitudes inusuales. Pensar antes de actuar puede evitar un engaГ±o.
Casinos sin DNI con tragamonedas populares – п»їhttps://casinossindni.space/
?Les deseo increibles encuentros !
casinossindni
This blog post is excellent, probably because of how well the subject was developed. I like some of the comments too.
I believe this web site has some really wonderful info for everyone : D.
Thank you a lot for sharing this with all folks you actually recognize what you’re speaking about! Bookmarked. Please additionally visit my site =). We can have a hyperlink trade contract among us!
Fantastic piece of writing here1
While this issue can vexed most people, my thought is that there has to be a middle or common ground that we all can find. I do value that you’ve added pertinent and sound commentary here though. Thank you!
I’ve been surfing online more than 3 hours today, yet I never found any interesting article like yours. It’s pretty worth enough for me. In my view, if all web owners and bloggers made good content as you did, the net will be much more useful than ever before.
?Salud por cada maestro de las apuestas !
Las promociones en casinos online internacionales se actualizan cada semana con grandes beneficios. Los usuarios disfrutan de RTP altos y mГ©todos de pago flexibles en casinos online internacionales. Los casinos online internacionales ofrecen experiencias Гєnicas con bonos exclusivos y juegos variados.
Un casino online fuera de EspaГ±a permite disfrutar de promociones personalizadas segГєn tu perfil. TambiГ©n ofrece atenciГіn al cliente en espaГ±ol y pagos instantГЎneos. Es una gran alternativa para quienes valoran la privacidad.
Explora casino por fuera con juegos en vivo y criptomonedas – п»їhttps://casinosinternacionalesonline.space/
Que tengas la fortuna de disfrutar brindemos por inolvidables giros !
Write more stories, more chapters.
A neighbor of mine encouraged me to take a look at your blog site couple weeks ago, given that we both love similar stuff and I will need to say I am quite impressed.
Great post, keep up the good work, I hope you don’t mind but I’ve added on my blog roll.
Thanks , I’ve recently been searching for info about this topic for ages and yours is the best I have discovered so far. But, what concerning the bottom line? Are you certain concerning the source?
I had highly recommend this blog to my good friend, it’s so good
I concur with your conclusions and will eagerly look forward to your future updates. The usefulness and significance is overwhelming and has been invaluable to me!
Great write-up, I am a big believer in placing comments on sites to inform the blog writers know that they’ve added something advantageous to the world wide web!
I cannot thank you more than enough for the blogposts on your website. I know you set a lot of time and energy into these and truly hope you know how deeply I appreciate it. I hope I’ll do a similar thing person sooner or later.
There is perceptibly a lot to identify about this. I consider you made some good points in features also.
WoW decent article. Can I hire you to guest write for my blog? If so send me an email!
Ten ranking prezentuje wyłącznie sprawdzone i legalne kasyna online Polska 2025, które oferują bezpieczną grę, ekskluzywne bonusy i uczciwe warunki. Znajdziesz tu szczegółowe analizy, aby świadomie wybrać najlepszą platformę dla siebie. Poniżej znajdziesz pełne opisy operatorów z naszego rankingu. Wstaw własne grafiki — obrazy wczytują się leniwie i zachowują naturalne proporcje (bez kadrowania).
Ten ranking prezentuje wyłącznie sprawdzone i legalne kasyna online Polska 2025, które oferują bezpieczną grę, ekskluzywne bonusy i uczciwe warunki. Znajdziesz tu szczegółowe analizy, aby świadomie wybrać najlepszą platformę dla siebie. Poniżej znajdziesz pełne opisy operatorów z naszego rankingu. Wstaw własne grafiki — obrazy wczytują się leniwie i zachowują naturalne proporcje (bez kadrowania).
Rynek kasyn online w Polsce charakteryzuje się szybkim wzrostem Młodzi dorośli korzystający z urządzeń mobilnych napędzają wzrost popularności kasyn online oferujących bonus powitalny. Totalizator Sportowy posiada monopol, regulowany na mocy Ustawy o Grach Hazardowych z 2009 roku, a Total Casino jest wiodącą platformą. Konkurencyjny krajobraz obejmuje krajowych i zagranicznych operatorów posiadających licencje z UE. Zaawansowane technologie, takie jak integracja z krupierami na żywo i optymalizacja mobilna, poprawiają doświadczenia użytkowników, podczas gdy wybór kasyna online staje się coraz bardziej złożony inicjatywy odpowiedzialnego hazardu zyskują na znaczeniu. Dowiedz się więcej o dynamice rynku i przyszłych perspektywach.
Rynek kasyn online w Polsce charakteryzuje się szybkim wzrostem Młodzi dorośli korzystający z urządzeń mobilnych napędzają wzrost popularności kasyn online oferujących bonus powitalny. Totalizator Sportowy posiada monopol, regulowany na mocy Ustawy o Grach Hazardowych z 2009 roku, a Total Casino jest wiodącą platformą. Konkurencyjny krajobraz obejmuje krajowych i zagranicznych operatorów posiadających licencje z UE. Zaawansowane technologie, takie jak integracja z krupierami na żywo i optymalizacja mobilna, poprawiają doświadczenia użytkowników, podczas gdy wybór kasyna online staje się coraz bardziej złożony inicjatywy odpowiedzialnego hazardu zyskują na znaczeniu. Dowiedz się więcej o dynamice rynku i przyszłych perspektywach.
However, it is virtually all done with tongues rooted solidly in cheeks, and everyone has absolutely nothing but absolutely love for his or her friendly neighborhood scapegoat. The truth is, he is not just a pushover. He is basically that special variety of person strong enough to take all of that good natured ribbing for exactly what it is.
Thanks For This Blog, was added to my bookmarks.
If most people wrote about this subject with the eloquence that you just did, I’m sure people would do much more than just read, they act. Great stuff here. Please keep it up.
Admiring the time and effort you put into your site and detailed info you offer!
Wow, amazing blog layout! How long have you been blogging for? you made blogging look easy. The overall look of your site is great, as well as the content!
This has to be one of my favorite posts! And on top of thats its also very helpful topic for newbies. thank a lot for the information!
It is perfect time to make some plans for the future and it is time to be happy. I’ve read this post and if I could I want to suggest you some interesting things or suggestions. Perhaps you can write next articles referring to this article. I wish to read more things about it!
There most be a solution for this problem, some people think there will be now solutions, but i think there wil be one.
My brother suggested I might like this web site. He was entirely right. This post actually made my day. You can not imagine simply how much time I had spent for this info! Thanks!
I am glad to be one of the visitors on this great site (:, appreciate it for putting up.
This contained some excellent tips and tools. Great blog publication.
This is really interesting, You’re a very skilled blogger. I have joined your feed and look forward to seeking more of your great post. Also, I’ve shared your web site in my social networks!
I am lucky that I discovered this website , precisely the right info that I was searching for! .
What a great article.. i subscribed btw!
Please let us know when you plan to publish your book!
?Brindemos por cada aventurero de la suerte !
Los jugadores deben entender que un casino sin licencia opera fuera de las normas nacionales. Esto significa que no hay mecanismos legales para recuperar dinero perdido por errores o fraudes. casinos sin licencia EspaГ±ola Conocer este detalle es clave para evitar problemas futuros.
Casinos sin licencia espaГ±ola carecen de mecanismos de autorregulaciГіn efectivos. En caso de problemas, el usuario no tiene a quiГ©n acudir para reclamar. Este vacГo legal representa el mayor riesgo de operar sin supervisiГіn.
Casino online sin licencia con juegos de NetEnt y Pragmatic – п»їhttps://casinossinlicenciaespanola.net/
?Que la fortuna te sonria con que vivas emocionantes triunfos !
Excellent article!! I am an avid reader of your website:D keep on posting that good content. and I’ll be a regular visitor for a very long time!!
When are you going to take this to a full book?
Thank you pertaining to sharing the following great subject matter on your website. I ran into it on google. I am going to check to come back after you publish additional aricles.
I have been surfing online more than three hours today, yet I never found anything that grabbed my interest as much as this piece.
If you don’t mind, where do you host your weblog? I am looking for a very good web host and your webpage seams to be extremely fast and up most the time…
?Brindemos por cada cazador de emociones fuertes !
Un casino sin licencia en EspaГ±a puede tener servidores ubicados en otros paГses con normativas mГЎs laxas. Este modelo internacional dificulta la supervisiГіn y el control de actividades sospechosas. casinos sin licencia EspaГ±ola Por eso, se recomienda jugar solo en sitios con licencias verificables.
Casinos online sin registro ofrecen anonimato, pero eso tambiГ©n dificulta la recuperaciГіn de cuentas. Si se pierde el acceso, el soporte no siempre puede verificar la identidad. Esto puede llevar a la pГ©rdida total de fondos.
Casino sin licencia con juegos de casino en vivo reales – п»їhttps://casinossinlicenciaespanola.net/
?Que la fortuna te sonria con que consigas asombrosos apuestas ganadoras !
?Un calido saludo para todos los aventureros del casino !
Un casino sin licencia espaГ±ola no tiene obligaciГіn de seguir las reglas de la DirecciГіn General de OrdenaciГіn del Juego. casinos sin licencia EspaГ±ola Esto implica que sus polГticas pueden ser opacas o arbitrarias. Los jugadores deben informarse antes de registrarse o depositar dinero.
El tГ©rmino casinos no regulados se usa para describir sitios que no poseen permiso gubernamental para operar. Estos portales pueden tener ventajas como menos restricciones o bonos mГЎs altos. No obstante, tambiГ©n aumentan los riesgos de fraude o pГ©rdida de fondos.
Casino online sin registro para jugadores espaГ±oles – п»їhttps://casinossinlicenciaenespana.net/
?Les deseo extraordinarios aventuras afortunadas!
casino sin licencia espaГ±a
Your posts provide a clear, concise description of the issues.
Took me time to read the material, but I truly loved the article. It turned out to be very useful to me.
Your thing regarding creating will be practically nothing in short supply of awesome. This informative article is incredibly useful and contains offered myself a better solution to be able to my own issues. Which can be the specific purpose MY PARTNER AND I has been doing a search online. I am advocating this informative article with a good friend. I know they are going to get the write-up since beneficial as i would. Yet again many thanks.
Hi, I just hopped over to your web-site through StumbleUpon. Not somthing I might typically browse, but I liked your views none the less. Thanks for making something worthy of reading through.
Nice piece of info! May I reference part of this on my blog if I post a backlink to this webpage? Thx.
This contained some excellent tips and tools. Great blog publication.
I encountered your site after doing a search for new contesting using Google, and decided to stick around and read more of your articles. Thanks for posting, I have your site bookmarked now.
88fc là nền tảng cá cược thể thao và casino trực tuyến hàng đầu tại châu Á, mang đến trải nghiệm giải trí an toàn và minh bạch cho người chơi.
fantastic internet site, I could definitely go to your web page once more…acquired some really nice info.
I like what you have to offer. Keep up the good work!
This is something that will need all of our combined efforts to address.
Great resources and tips for families here.
Only a smiling visitor here to share the love (:, btw outstanding style and design .
I am glad to be a visitor of this perfect blog !, appreciate it for this rare info!
Great post. Just a heads up – I am running Ubuntu with the beta of Firefox and the navigation of your blog is kind of broken for me.
Thank you for the auspicious writeup.
Do you offer workshops?
Took me time to read the material, but I truly loved the article. It turned out to be very useful to me.
I’ll check back after you publish more articles.
You are one talented writer thank you for the post.
Woh I enjoy your content , saved to bookmarks!
I would really like to appreciate the endeavors you cash in on written this article. I’m going for the similar best product from you finding out in the foreseeable future as well. Actually your creative writing abilities has urged me to begin my very own blog now. Genuinely the blogging is distributing its wings rapidly. Your write down is often a fine illustration showing it.
of course like your web-site however you have to check the spelling on several of your posts. Many of them are rife with spelling problems and I find it very troublesome to tell the reality then again I will surely come back again.
Well done! Keep up this quality!
Some truly interesting info , well written and broadly user genial .
I don’t know if it’s just me or if everybody else experiencing issues with your site. It appears as though some of the written text on your content are running off the screen. Can someone else please provide feedback and let me know if this is happening to them as well? This could be a problem with my web browser because I’ve had this happen before. Appreciate it
This is the wave – the big wave.
Only a smiling visitor here to share the love (:, btw outstanding style and design .
Just what I needed to know thank you for this.
?Brindemos por cada explorador de tesoros !
Un casino online fuera de espaГ±a publica informes mensuales de RTP real de cada slot. Compara el retorno teГіrico con el rendimiento actual del mes en curso. casino fuera de espaГ±a La transparencia te permite elegir juegos con mejor desempeГ±o reciente.
Un casino online fuera de espaГ±a te permite pausar tu sesiГіn y retomarla desde cualquier dispositivo. Tu progreso se sincroniza automГЎticamente en la nube. La flexibilidad es total.
Casinos fuera de EspaГ±a verifican identidad de forma simple – п»їhttps://casinosonlinefueradeespana.net/
?Que la fortuna te sonria con que vivas increibles victorias inolvidables!
Excellent article!! I am an avid reader of your website:D keep on posting that good content. and I’ll be a regular visitor for a very long time!!
Very Interesting Information! Thank You For Thi Information!
Thanks For This Blog, was added to my bookmarks.
Woh I enjoy your content , saved to bookmarks!
How do I subscribe to your blog? Thanks for your help.
There are some serious financial ramifications here.
Our communities really need to deal with this.
Clear, concise and easy to access.
It’s clear you’re passionate about the issues.
How long does it take you to write an article like this?
Good job for bringing something important to the internet!
I have to disagree with most of the comments here, but maybe I’m just a contrarian.
Some truly interesting info , well written and broadly user genial .
This website has lots of really useful stuff on it. Thanks for informing me.
I really love this article.
This is really interesting, You’re a very skilled blogger. I have joined your feed and look forward to seeking more of your fantastic post. Also, I have shared your website in my social networks!
OK, you outline what is a big issue. But, can’t we develop more answers in the private sector?
You write Formidable articles, keep up good work.
How do I subscribe to your blog? Thanks for your help.
Hello there, just became aware of your blog through Google, and found that it is truly informative. I am going to watch out for brussels. I will appreciate if you continue this in future. Lots of people will be benefited from your writing. Cheers!
This is a great blog. Thank you for the very informative post.
Thanks pertaining to discussing the following superb written content on your site. I ran into it on the search engines. I will check back again if you publish extra aricles.
This is something that will need all of our combined efforts to address.
Are grateful for this blog post, it’s tough to find good information and facts on the internet
There is a lot of misunderstanding about these issues today. Your material helps explain things.
Thank you for sharing this very good post. Very interesting ideas! (as always, btw)
Nice read, I just passed this onto a colleague who was doing some research on that. And he just bought me lunch as I found it for him smile Therefore let me rephrase that: Thank you for lunch!
Great info! Keep post great articles.
you’re in reality a just right webmaster. The web site loading velocity is incredible. It sort of feels that you’re doing any distinctive trick. In addition, The contents are masterpiece. you’ve performed a great process on this topic!
Pretty nice post. I just stumbled upon your weblog and wanted to say that I’ve really enjoyed surfing around your blog posts. After all I’ll be subscribing in your feed and I am hoping you write again very soon!
There are some serious financial ramifications here.
Great blog here! Also your site loads up very fast! What web host are you using? Can I get your affiliate link to your host? I wish my website loaded up as fast as yours lol
Very Interesting Information! Thank You For Thi Information!
It’s the best time to make some plans for the future and it is time to be happy. I’ve read this post and if I could I wish to suggest you some interesting things or tips. Maybe you can write next articles referring to this article. I wish to read even more things about it!
This is definitely a wonderful webpage, thanks a lot..
What a great article.. i subscribed btw!
Admiring the time and effort you put into your site and detailed info you offer!
Nice blog here! Also your web site loads up very fast! What host are you using? Can I get your affiliate link to your host? I wish my web site loaded up as fast as yours lol
I imagine so. Very good stuff, I agree totally.
very good post, i certainly love this web site, keep on it
you’re in reality a just right webmaster. The web site loading velocity is incredible. It sort of feels that you’re doing any distinctive trick. In addition, The contents are masterpiece. you’ve performed a great process on this topic!
These are some of the most important issues we’ll face over the next few decades.
I am glad to be one of the visitors on this great site (:, appreciate it for putting up.
Are the issues really as complex as they seem?
I am glad to be one of the visitors on this great site (:, appreciate it for putting up.
very good post, i certainly love this web site, keep on it
I like what you have to offer. Keep up the good work!
Thanks pertaining to discussing the following superb written content on your site. I ran into it on the search engines. I will check back again if you publish extra aricles.
Hi there, just became aware of your blog through Google, and found that it’s truly informative. It’s important to cover these trends.
Very often I go to see this blog. It very much is pleasant to me. Thanks the author
I found your blog through google and I must say, this is probably one of the best well prepared articles I have come across in a long time. I have bookmarked your site for more posts.
I’ve read several good stuff here. Definitely worth bookmarking for revisiting. I surprise how much effort you put to make such a magnificent informative site.
Great resources and tips for families here.
Public policy is key here, and our states need to develop some strategies – – soon.
Hiya, I am really glad I have found this information. Nowadays bloggers publish only about gossip and net stuff and this is actually frustrating.
Just want to say what a great blog you got here!I’ve been around for quite a lot of time, but finally decided to show my appreciation of your work!
I think that may be an interesting element, it made me assume a bit. Thanks for sparking my considering cap. On occasion I get so much in a rut that I simply really feel like a record.
Unquestionably believe that which you said. Your favorite reason seemed to be on the net the easiest thing to be aware of. I say to you, I certainly get annoyed while people consider worries that they plainly don’t know about. You managed to hit the nail on the head. Will probably be back to get more. Thanks
I dont think Ive caught all the angles of this subject the way youve pointed them out. Youre a true star, a rock star man. Youve got so much to say and know so much about the subject that I think you should just teach a class about it
I’m impressed, I need to say. Really rarely do I encounter a blog that’s both educational and entertaining, and let me tell you, you have hit the nail on the head.
I simply could not leave your site before suggesting that I actually enjoyed the usual info a person supply in your visitors? Is going to be back often to inspect new posts
Your idea is outstanding; the issue is something that not enough persons are speaking intelligently about. I’m very happy that I stumbled throughout this in my seek for one thing regarding this.
I like what you have to offer. Keep up the good work!
Good site! I truly love how it is easy on my eyes it is. I am wondering how I might be notified when a new post has been made. I’ve subscribed to your RSS which may do the trick? Have a great day!
Beneficial Blog! I had been simply just debating that there are plenty of screwy results at this issue you now purely replaced my personal belief. Thank you an excellent write-up.
Greetings, have tried to subscribe to this websites rss feed but I am having a bit of a problem. Can anyone kindly tell me what to do?’
Unquestionably believe that which you said. Your favorite reason seemed to be on the net the easiest thing to be aware of. I say to you, I certainly get annoyed while people consider worries that they plainly don’t know about. You managed to hit the nail on the head. Will probably be back to get more. Thanks
Woh I enjoy your content , saved to bookmarks!
Peculiar this blog is totaly unrelated to what I was searching for – – interesting to see you’re well indexed in the search engines.
Are grateful for this blog post, it’s tough to find good information and facts on the internet
have already been reading ur blog for a couple of days. really enjoy what you posted. btw i will be doing a report about this topic. do you happen to know any great websites or forums that I can find out more? thanks a lot.
It’s clear you’re passionate about the issues.
This website has lots of really useful stuff on it. Thanks for informing me.
You certainly deserve a round of applause for your post and more specifically, your blog in general. Very high quality material!
I loved your idea there, I tell you blogs are so exciting sometimes like looking into people’s private life’s and work. Every new remark wonderful in its own right.
Assume you are doing good linking to position you on the first pages of search engines.
This contained some excellent tips and tools. Great blog publication.
Wow, amazing blog layout! How long have you been blogging for? you make blogging look easy. The overall look of your site is wonderful, let alone the content!
Thank you a lot for sharing this with all folks you actually recognize what you’re speaking about! Bookmarked. Please additionally visit my site =). We can have a hyperlink trade contract among us!
You are one talented writer thank you for the post.
Great write-up, I am a big believer in placing comments on sites to inform the blog writers know that they’ve added something advantageous to the world wide web!
A neighbor of mine encouraged me to take a look at your blog site couple weeks ago, given that we both love similar stuff and I will need to say I am quite impressed.
You are my inspiration , I possess few web logs and very sporadically run out from to brand 🙁
I like to spend my free time by scanning various internet resources. Today I came across your website and I found it has some of the most practical and helpful information I’ve seen.
This will be helpful for my family.
Magnificent beat ! Can I be your apprentice? Just kidding!
Thanks , I’ve recently been searching for info about this topic for ages and yours is the best I have discovered so far. But, what concerning the bottom line? Are you certain concerning the source?
A thoughtful insight and ideas I will use on my blog. You’ve obviously spent some time on this. Congratulations
?Brindemos por cada descubridor de riquezas !
En crypto casino no kyc encuentras derivados de apuestas negociables. Puedes especular sobre resultados futuros activamente. Los mercados financieros convergen en casinosinverificacion.org/.
Los casino sin registro ofrecen bonos sin depГіsito para probar la plataforma. Puedes jugar gratis antes de comprometer fondos propios. El casino sin dni te permite experimentar sin riesgos.
Visita casinosinverificacion.org/ y gana sin restricciones – п»їhttps://casinosinverificacion.org/
?Que la fortuna te sonria con que alcances grandiosos jugadas exitosas !
I love what you’ve created here, this is definitely one of my favorite sites to visit.
This blog post is excellent, probably because of how well the subject was developed. I like some of the comments too.
Please let us know when you plan to publish your book!
Great post, keep up the good work, I hope you don’t mind but I’ve added on my blog roll.
This is something that will need all of our combined efforts to address.
When are you going to post again? You really entertain me!
I believe this web site has some really wonderful info for everyone : D.
I think other website proprietors should take this web site as an model, very clean and great user pleasant style and design .
I really believe you will do well in the future I appreciate everything you have added to my knowledge base.
Awesome post. It’s so good to see someone taking the time to share this information
Glad to be one of several visitors on this awful internet site : D.
What’s Happening i’m new to this, I stumbled upon this I’ve found It positively useful and it has aided me out loads. I hope to contribute & help other users like its aided me. Great job.
Fantastic piece of writing here1
Keep it up!. I usually don’t post in Blogs but your blog forced me to, amazing work.. beautiful A rise in An increase in An increase in.
I have to disagree with most of the comments here, but maybe I’m just a contrarian.
We’re developing a conference, and it looks like you would be a great speaker.
You are good writer. Thank you.
Easily, the post is really the greatest on this laudable topic. I concur with your conclusions and will thirstily look forward to your future updates. Saying thank will not just be sufficient, for the wonderful c lucidity in your writing. I will instantly grab your rss feed to stay privy of any updates. Solid work and much success in your business enterprise!
I am lucky that I discovered this website , precisely the right info that I was searching for! .
Easily, the post is really the greatest on this laudable topic. I concur with your conclusions and will thirstily look forward to your future updates. Saying thank will not just be sufficient, for the wonderful c lucidity in your writing. I will instantly grab your rss feed to stay privy of any updates. Solid work and much success in your business enterprise!
Hi, do have a e-newsletter? In the event you don’t definately should get on that piece…this web site is pure gold!
This website has lots of really useful stuff on it. Thanks for informing me.
Thanks for posting this. Looking for these resources 😀
Cherished is likely to be what people say about your comments.
Took me time to read the material, but I truly loved the article. It turned out to be very useful to me.
Just a quick note to express my appreciation. Take care
Well, I don’t know if that’s going to work for me, but definitely worked for you! 🙂 Excellent post!
It sounds like you’re creating problems yourself by defining this as such a comprehensive, almost unknowable problem. Isn’t that self-defeating?
The clarity in your post is just nice and I can tell you are an expert in the subject matter.
Greetings… your blog is very interesting and beautifully written.
Clear, concise and easy to access.
Thank you for the auspicious writeup.
Hello, I think your blog might be having browser compatibility issues. When I look at your website in Chrome, it looks fine but when opening in Internet Explorer, it has some overlapping. I just wanted to give you a quick heads up! Other than that, awesome blog!
I like what you have to offer. Keep up the good work!
It is perfect time to make some plans for the future and it is time to be happy. I’ve read this post and if I could I want to suggest you some interesting things or suggestions. Perhaps you can write next articles referring to this article. I wish to read more things about it!
I just couldn’t leave your web site prior to suggesting that I really enjoyed the standard info an individual supply to your guests? Is going to be again continuously in order to inspect new posts
Clear, concise and easy to access.
Thanks For This Blog, was added to my bookmarks.
Nice blog. Could someone with little experience do it, and add updates without messing it up? Good information on here, very informative.
Its just like you read my thoughts! It’s like reading about my family.
Thanks for posting this. Looking for these resources 😀
I want to see your book when it comes out.
I am glad to be a visitor on this website!, regards for this rare information!
Howdy I wanted to write a new remark on this page for you to be able to tell you just how much i actually Enjoyed reading this read. I have to run off to work but want to leave ya a simple comment. I saved you So will be returning following work in order to go through more of yer quality posts. Keep up the good work.
thank, I thoroughly enjoyed reading your article. I really appreciate your wonderful knowledge and the time you put into educating the rest of us.
I’m partial to blogs and i actually respect your content. The article has actually peaks my interest. I am going to bookmark your site and preserve checking for new information.
Thanks , I’ve recently been searching for info about this topic for ages and yours is the best I have discovered so far. But, what concerning the bottom line? Are you certain concerning the source?
Amazing! Your site has quite a few comment posts. How did you get all of these bloggers to look at your site I’m envious! I’m still studying all about posting articles on the net. I’m going to view pages on your website to get a better understanding how to attract more people. Thank you!
Took me time to read the material, but I truly loved the article. It turned out to be very useful to me.
There are some serious financial ramifications here.
What’s Happening i’m new to this, I stumbled upon this I’ve found It positively useful and it has aided me out loads. I hope to contribute & help other users like its aided me. Great job.
Hi my family member! I want to say that this article is amazing, great written and include approximately all important infos. I’d like to see more posts like this .
I’ve read several good stuff here. Definitely worth bookmarking for revisiting. I surprise how much effort you put to make such a magnificent informative site.
Can I just say what a relief to seek out someone who actually knows what theyre speaking about on the internet. You positively know find out how to bring a problem to mild and make it important. Extra individuals have to read this and perceive this side of the story. I cant believe youre not more in style because you positively have the gift.
I just added this to my favorites. I truly love reading your posts. Tyvm!
Just stumble upon your blog from from time to time. nice article
We need to build frameworks and funding mechanisms.
There is perceptibly a lot to identify about this. I consider you made some good points in features also.
I don’t normally comment but I gotta say appreciate it for the post on this one : D.
Write more stories, more chapters.
Greetings! This is my first visit to your blog! We are a collection of volunteers and starting a new initiative in a community in the same niche. Your blog provided us beneficial information. You have done a wonderful job!
WoW decent article. Can I hire you to guest write for my blog? If so send me an email!
I would really like to appreciate the endeavors you cash in on written this article. I’m going for the similar best product from you finding out in the foreseeable future as well. Actually your creative writing abilities has urged me to begin my very own blog now. Genuinely the blogging is distributing its wings rapidly. Your write down is often a fine illustration showing it.
When are you going to take this to a full book?
Certainly. And I have faced it. Let’s discuss this question. Here or in PM.
I encountered your site after doing a search for new contesting using Google, and decided to stick around and read more of your articles. Thanks for posting, I have your site bookmarked now.
very good post, i certainly love this web site, keep on it
Beneficial Blog! I had been simply just debating that there are plenty of screwy results at this issue you now purely replaced my personal belief. Thank you an excellent write-up.
I like your quality that you put into your writing . Please do continue with more like this.
Hello there, You have done an incredible job. I will certainly digg it and personally recommend to my friends. I am sure they will be benefited from this site.
Its just like you read my thoughts! It’s like reading about my family.
Admiring the time and effort you put into your site and detailed info you offer!
I think this is among the so much vital info for me. And i’m happy reading your article. But wanna remark on few common issues, The site style is wonderful, the articles is really excellent : D. Just right job, cheers
I found your blog through google and I must say, this is probably one of the best well prepared articles I have come across in a long time. I have bookmarked your site for more posts.
I’m impressed, I need to say. Really rarely do I encounter a blog that’s both educational and entertaining, and let me tell you, you have hit the nail on the head.
It’s the best time to make some plans for the future and it is time to be happy. I’ve read this post and if I could I wish to suggest you some interesting things or tips. Maybe you can write next articles referring to this article. I wish to read even more things about it!
Sweet blog! I found it while browsing on Yahoo News. Do you have any tips on how to get listed in Yahoo News? I’ve been trying for a while but I never seem to get there! Thank you
Of course, what a great site and informative posts, I will add backlink – bookmark this site? Regards, Reader
Excellent article!! I am an avid reader of your website:D keep on posting that good content. and I’ll be a regular visitor for a very long time!!
I really believe you will do well in the future I appreciate everything you have added to my knowledge base.
Admiring the time and effort you put into your site and detailed info you offer!
You are my inhalation , I possess few web logs and very sporadically run out from to brand 🙁
I will share you blog with my sis.
Well done! Keep up this quality!
You are my inhalation , I possess few web logs and very sporadically run out from to brand 🙁
I absolutely adore your site! You aggressive me as able-bodied as all the others actuality and your broiled PS is absolutely great!
That’s some inspirational stuff. Never knew that opinions might be this varied. Thanks for all the enthusiasm to supply such helpful information here.
whoah this weblog is great i really like studying your articles. Stay up the great work! You already know, lots of persons are looking round for this information, you can aid them greatly.
Certainly. And I have faced it. Let’s discuss this question. Here or in PM.
Nice post.Very useful info specifically the last part 🙂 Thank you and good luck.
How long does it take you to write an article like this?
When we look at these issues, we know that they are the key ones for our time.
Wow, amazing blog layout! How long have you been blogging for? you make blogging look easy. The overall look of your site is wonderful, let alone the content!
Just wanna admit that this is extremely helpful, Thanks for taking your time to write this.
I wish I could craft such articles as this. Thank you very much.
How do I subscribe to your blog? Thanks for your help.
I have been surfing online more than three hours today, yet I never found anything that grabbed my interest as much as this piece.
Unquestionably believe that which you said. Your favorite reason seemed to be on the net the easiest thing to be aware of. I say to you, I certainly get annoyed while people consider worries that they plainly don’t know about. You managed to hit the nail on the head. Will probably be back to get more. Thanks
Sweet blog! I found it while browsing on Yahoo News. Do you have any tips on how to get listed in Yahoo News? I’ve been trying for a while but I never seem to get there! Thank you
I really believe you will do well in the future I appreciate everything you have added to my knowledge base.
The start of a fast-growing trend?
My brother suggested I might like this websiteHe was once totally rightThis post truly made my dayYou can not imagine simply how a lot time I had spent for this information! Thanks!
Good post. I study something more difficult on different blogs everyday. It’s going to always be stimulating to learn content material from other writers and observe a little bit one thing from their store. I’d prefer to use some with the content material on my blog whether you don’t mind. Natually I’ll give you a link in your web blog. Thanks for sharing.
OK, you outline what is a big issue. But, can’t we develop more answers in the private sector?
Abnormal this put up is totaly unrelated to what I was searching google for, but it surely used to be listed at the first page. I suppose your doing one thing proper if Google likes you adequate to place you at the first page of a non similar search.
There is perceptibly a lot to identify about this. I consider you made some good points in features also.
Great post. Just a heads up – I am running Ubuntu with the beta of Firefox and the navigation of your blog is kind of broken for me.
Very Interesting Information! Thank You For Thi Information!
I feel that is among the so much significant info for me. And i am satisfied studying your article. However should commentary on some basic issues, The site style is ideal, the articles is in reality excellent : D. Excellent activity, cheers
Thanks for a Interesting item; I enjoyed it very much. Regards Sang Magistrale
I just couldn’t leave your web site prior to suggesting that I really enjoyed the standard info an individual supply to your guests? Is going to be again continuously in order to inspect new posts
I have been surfing online more than three hours today, yet I never found anything that grabbed my interest as much as this piece.
WoW decent article. Can I hire you to guest write for my blog? If so send me an email!
Thanks for posting this. Looking for these resources 😀
Have you always been concerned about these issues?
Enjoyed studying this, very good stuff, thanks.
My coder is trying to convince me to move to .net from PHP. I have always disliked the idea because of the expenses. But he’s tryiong none the less. I’ve been using WordPress on numerous websites for about a year and am nervous about switching to another platform. I have heard great things about blogengine.net. Is there a way I can import all my wordpress posts into it? Any help would be really appreciated!
Hello. Great job. I did not expect this on a Wednesday. This is a great story. Thanks!
Howdy I wanted to write a new remark on this page for you to be able to tell you just how much i actually Enjoyed reading this read. I have to run off to work but want to leave ya a simple comment. I saved you So will be returning following work in order to go through more of yer quality posts. Keep up the good work.
Assume you are doing good linking to position you on the first pages of search engines.
I think it is a nice point of view. I most often meet people who rather say what they suppose others want to hear. Good and well written! I will come back to your site for sure!
Nice Post. It’s really a very good article. I noticed all your important points. Thanks.
Dude.. I am not much into reading, but somehow I got to read lots of articles on your blog. Its amazing how interesting it is for me to visit you very often. –
Our community leaders need to read this, and look at developing some of your recommendations.
Greetings… your blog is very interesting and beautifully written.
Nice blog here! Also your web site loads up very fast! What host are you using? Can I get your affiliate link to your host? I wish my web site loaded up as fast as yours lol
This information is very important and you’ll need to know this when you constructor your own photo voltaic panel.
With internet full of dupe articles it is nice to find original content like yours thank you so very much.
Great post. Just a heads up – I am running Ubuntu with the beta of Firefox and the navigation of your blog is kind of broken for me.
Abnormal this put up is totaly unrelated to what I was searching google for, but it surely used to be listed at the first page. I suppose your doing one thing proper if Google likes you adequate to place you at the first page of a non similar search.
It’s the best time to make some plans for the future and it is time to be happy. I’ve read this post and if I could I wish to suggest you some interesting things or tips. Maybe you can write next articles referring to this article. I wish to read even more things about it!
If you don’t mind, where do you host your weblog? I am looking for a very good web host and your webpage seams to be extremely fast and up most the time…
Nice blog. Could someone with little experience do it, and add updates without messing it up? Good information on here, very informative.
This is my first time i visit here. I found so many helpful stuff in your website especially its discussion. From the tons of responses on your posts, I guess I am not the only one having all the enjoyment here! keep up the excellent work
Thank you a lot for sharing this with all folks you actually recognize what you’re speaking about! Bookmarked. Please additionally visit my site =). We can have a hyperlink trade contract among us!
This blog post is excellent, probably because of how well the subject was developed. I like some of the comments too though I could prefer we all stay on the subject in order add value to the subject!
Hello. Great job. I did not expect this on a Wednesday. This is a great story. Thanks!
I would share your post with my sis.
Thanks for some other great post. Where else may anybody get that kind of information in such an ideal method of writing? I’ve a presentation next week, and I am at the look for such information.
It’s continually awesome when you can not only be informed, but also entertained! I’m sure you had fun writing this article. Regards, Clotilde.
What’s Happening i’m new to this, I stumbled upon this I’ve found It positively useful and it has aided me out loads. I hope to contribute & help other users like its aided me. Great job.
Most often since i look for a blog Document realize that the vast majority of blog pages happen to be amateurish. Not so,We can honestly claim for which you writen is definitely great and then your webpage rock solid.
You certainly deserve a round of applause for your post and more specifically, your blog in general. Very high quality material!
Great blog here! Additionally your website rather a lot up very fast! What host are you the usage of? Can I get your associate link for your host? I desire my website loaded up as fast as yours lol
Howdy! I simply wish to give a huge thumbs up for the great information you have here on this post. I will be coming again to your weblog for extra soon.
I concur with your conclusions and will eagerly look forward to your future updates. The usefulness and significance is overwhelming and has been invaluable to me!
I’ve thought about posting something about this before. Good job! Can I use part of your post in my blog?
I came across an article that talks about the same thing but even more and when you go deeper.
Abnormal this put up is totaly unrelated to what I was searching google for, but it surely used to be listed at the first page. I suppose your doing one thing proper if Google likes you adequate to place you at the first page of a non similar search.
I had highly recommend this blog to my good friend, it’s so good
Well, I don’t know if that’s going to work for me, but definitely worked for you! 🙂 Excellent post!
Thanks for another great post. Where else may anybody get that type of info in such an ideal way of writing? I have a presentation next week, and I’m at the search for such information.
We are a group of volunteers and starting a new initiative in our community. Your blog provided us with valuable information to work on|.You have done a marvellous job!
Very fine blog.
Advanced reading here!
Thank you for this great piece of content. Best Regards
A colleague in the field told me to check out your website.
I appreciate, cause I found just what I was looking for. You’ve ended my four day long hunt! God Bless you man. Have a great day. Bye -.
However, it is virtually all done with tongues rooted solidly in cheeks, and everyone has absolutely nothing but absolutely love for his or her friendly neighborhood scapegoat. The truth is, he is not just a pushover. He is basically that special variety of person strong enough to take all of that good natured ribbing for exactly what it is.
I would share your post with my sis.
I really believe you will do well in the future I appreciate everything you have added to my knowledge base.
I am lucky that I discovered this website , precisely the right info that I was searching for! .
I favored your idea there, I tell you blogs are so helpful sometimes like looking into people’s private life’s and work.At times this world has too much information to grasp. Every new comment wonderful in its own right.
I am glad to talk with you and you give me great help
The post is absolutely great! Lots of great info and inspiration, both of which we all need! Also like to admire the time and effort you put into your blog and detailed information you offer! I will bookmark your website!
Of course, what a great site and informative posts, I will add backlink – bookmark this site? Regards, Reader
Hey very cool site!! Man .. Beautiful .. Amazing .. I will bookmark your website and take the feeds also…I’m happy to find so many useful information here in the post, we need develop more strategies in this regard, thanks for sharing. . . . . .
I believe this web site has some really wonderful info for everyone : D.
If most people wrote about this subject with the eloquence that you just did, I’m sure people would do much more than just read, they act. Great stuff here. Please keep it up.
Great info! Keep post great articles.
You ma’am have a way with words. Thank you very much!
I think that may be an interesting element, it made me assume a bit. Thanks for sparking my considering cap. On occasion I get so much in a rut that I simply really feel like a record.
I just couldn’t leave your web site prior to suggesting that I really enjoyed the standard info an individual supply to your guests? Is going to be again continuously in order to inspect new posts
The sketch is tasteful, your authored material stylish.
You have some helpful ideas! Maybe I should consider doing this by myself.
Just want to say what a great blog you got here!I’ve been around for quite a lot of time, but finally decided to show my appreciation of your work!
I love what you’ve created here, this is definitely one of my favorite sites to visit.
I feel that is among the so much significant info for me. And i am satisfied studying your article. However should commentary on some basic issues, The site style is ideal, the articles is in reality excellent : D. Excellent activity, cheers
Are the issues really as complex as they seem?
I’d like to be able to write like this, but taking the time and developing articles is hard…. Takes a lot of effort.
It’s the best time to make some plans for the future and it is time to be happy. I’ve read this post and if I could I wish to suggest you some interesting things or tips. Maybe you can write next articles referring to this article. I wish to read even more things about it!
Of course, what a great site and informative posts, I will add backlink – bookmark this site? Regards, Reader
?Celebremos a cada forjador del sino!
casinos sin licencia espaГ±ola permiten mГєltiples formas de pago modernas. Un casino sin licencia espaГ±a elimina restricciones innecesarias. casinos sin licencia en espaГ±a Usuarios confГan en caponesaurora.es por su eficiencia.
casinos sin licencia espaГ±a brindan acceso inmediato a miles de juegos. Un casino sin licencia espaГ±ola mejora la experiencia del usuario. caponesaurora.es se posiciona como referente.
Flexibilidad de pago en casinos sin licencia en espaГ±a – caponesaurora.es
?Que la fortuna te favorezca con que el azar te ofrezca vibrantes ganancias sorpresivas !
?Brindiamo per ogni trionfatore del massimo premio !
Explorar
propio. Muchos usuarios confГan en
La mejor forma de usar tiradasgratissindeposito.es de manera segura – tiradasgratissindeposito.es/
?Che la fortuna ti sorrida con che tu ottenga straordinari premi meravigliosi !
We can see that we need to develop policies to deal with this trend.
I like your blog. It sounds every informative.
Very often I go to see this blog. It very much is pleasant to me. Thanks the author
Developing a framework is important.
Well done! Keep up this quality!
Best American Healthcare University offers CNA certification training classes Online. Train from anywhere in California. Complete the 160 hybrid course. Clinical hours are completed in person in a skilled nursing facility. This program is state approved. Remember certification only comes after the student successfully passes the state exam. You only need your phone for the online class and a google chrome browser. A computer is great, but not necessarily needed. 951 637 8332. Enroll now at https://www.bestamericanhealthed.com/online-cna-program
Keep it up!. I usually don’t post in Blogs but your blog forced me to, amazing work.. beautiful A rise in An increase in An increase in.
Best American Healthcare University offers CNA certification training classes Online. Train from anywhere in California. Complete the 160 hybrid course. Clinical hours are completed in person in a skilled nursing facility. This program is state approved. Remember certification only comes after the student successfully passes the state exam. You only need your phone for the online class and a google chrome browser. A computer is great, but not necessarily needed. 951 637 8332. Enroll now at https://www.bestamericanhealthed.com/online-cna-program
Our community leaders need to read this, and look at developing some of your recommendations.
I want to see your book when it comes out.
It sounds like you’re creating problems yourself by defining this as such a comprehensive, almost unknowable problem. Isn’t that self-defeating?
We are a group of volunteers and starting a new initiative in our community. Your blog provided us with valuable information to work on|.You have done a marvellous job!
There most be a solution for this problem, some people think there will be now solutions, but i think there wil be one.
of course like your web-site however you have to check the spelling on several of your posts. Many of them are rife with spelling problems and I find it very troublesome to tell the reality then again I will surely come back again.
Amazing content on your website.
Hi, possibly i’m being a little off topic here, but I was browsing your site and it looks stimulating. I’m writing a blog and trying to make it look neat, but everytime I touch it I mess something up. Did you design the blog yourself?
very good post, i certainly love this web site, keep on it
Thanks for some other great post. Where else may anybody get that kind of information in such an ideal method of writing? I’ve a presentation next week, and I am at the look for such information.
These stories are so important.
Cherished is likely to be what people say about your comments.
Hello there, You have done an incredible job. I will certainly digg it and personally recommend to my friends. I am sure they will be benefited from this site.
Hi my family member! I want to say that this article is amazing, great written and include approximately all important infos. I’d like to see more posts like this .
A thoughtful insight and ideas I will use on my blog. You’ve obviously spent some time on this. Congratulations
I concur with your conclusions and will eagerly look forward to your future updates. The usefulness and significance is overwhelming and has been invaluable to me!
Admiring the time and effort you put into your site and detailed info you offer!
It’s a comprehensive, yet fast read.
Greetings, have tried to subscribe to this websites rss feed but I am having a bit of a problem. Can anyone kindly tell me what to do?’
I’m so happy to read this. This is the type of manual that needs to be given and not the random misinformation that’s at the other blogs. Appreciate your sharing this best doc.
Glad to be one of several visitors on this awful internet site : D.
I just added this to my favorites. I truly love reading your posts. Tyvm!
Thanks a bunch for sharing this with all people you really recognize what you are talking about! Bookmarked. Kindly also seek advice from my web site =). We can have a link alternate contract between us!
Just came from google to your website have to say thanks.
A friend of mine advised me to review this site. And yes. it has some useful pieces of info and I enjoyed reading it.
Nice blog here! Also your web site loads up very fast! What host are you using? Can I get your affiliate link to your host? I wish my web site loaded up as fast as yours lol
Lovely just what I was looking for. Thanks to the author for taking his clock time on this one.
Took me time to read all the comments, but I really enjoyed the article. It proved to be Very helpful to me and I am sure to all the commenters here It’s always nice when you can not only be informed, but also entertained I’m sure you had fun writing this article.
This information is very important and you’ll need to know this when you constructor your own photo voltaic panel.
I enjoy your blog posts, saved to my bookmarks!
Your dedication to quality really shows here.
This is one of the most exciting posts I’ve read in a long time!
You’re such a vibrant writer — this was amazing!
You have a remarkable way of connecting ideas.
You’re raising the bar with posts like this.
I’m consistently impressed by the quality of your work.
Just WOW. This exceeded every expectation!
This is insanely good — bookmarking immediately!
Absolutely brilliant — I’ll be bookmarking this!
This is one of the most exciting posts I’ve read in a long time!
Such a dynamic and exciting piece — I’m impressed!
You’ve done an amazing job explaining this.
Your enthusiasm makes learning fun — brilliant job!
This is content worth celebrating — phenomenal job!
I can feel your excitement through the screen — awesome!
This post had me completely fired up — thank you!
I learned so much from this one article.
This was such an electrifying read — awesome job!
You make learning so enjoyable — thank you!
You have a real talent for simplifying complex subjects.
Your passion elevates every topic — brilliant writing!
I felt the excitement building as I read — fantastic job!
I learned a lot — thank you for sharing!
Absolutely loving the energy and clarity here — wow!
This is one of the most helpful articles I’ve seen recently.
This was both informative and enjoyable — great combo!
You’ve created something truly valuable here.
I’m blown away by the value in this post.
I appreciate the thoughtfulness in everything you write.
Wow!! I’m honestly amazed by how good this was!
This is the kind of content people rave about — amazing!
This absolutely energized my day — thank you!
I learned so many new things from this article.
This post really exceeded my expectations.
Every sentence is infused with excitement — incredible work!
Thank you for putting so much heart into your writing.
Such a thrilling and inspiring read — well done!
This post just made my morning.
I admire the clarity and depth in your writing.
This content stands out from anything else I’ve read on this subject.
This is the kind of writing that keeps readers coming back — excellent!
Your perspective here is so valuable.
You’ve crafted such a thoughtful and detailed piece.
This was refreshingly exciting — loved it!
Such a lively, powerful burst of content — awesome!
I learned so many new things from this article.
This article practically radiates enthusiasm — fantastic!
This made me feel genuinely motivated — thank you!
You always leave readers better informed — thank you!
You truly have a gift for writing.
This was incredibly helpful — thank you!
Thank you for putting so much effort into your work.
This article had my full attention — amazing writing!
This was such a well-structured and thoughtful read.
I can feel the joy behind your words — so refreshing!
This is real quality content — thank you!
Everything about this post screams excellence!
I learned a lot — thank you for sharing!
Such a beautifully expressed and insightful article.
Your energy is absolutely unmatched — fantastic read!
I’m genuinely in awe — this is exceptional!
Amazing content! I’m so glad I found this post.
You’ve got a gift — this is stellar!
This was extremely well written and very helpful.
You truly have a gift for writing.
I’m so glad I found this — what an exciting read!
Your dedication to quality really shows here.
Your energy is absolutely unmatched — fantastic read!
This post had me smiling from start to finish — thank you!
You make complicated concepts feel effortless.
I felt the excitement building as I read — fantastic job!
I love how you break things down so clearly.
Hands down one of the best things I’ve read all week!
Such a vibrant, powerful, exciting read — THANK YOU!
This was packed with value from start to finish.
Everything about this post feels exciting — incredible!
This is adrenaline in written form — AWESOME!
You truly have a gift for writing.
You’ve delivered another gem — well done!
This lit up my whole mood — thank you for this!
Your enthusiasm is magnetic — I love it!
This post shines with passion and energy — fantastic!
Completely captivated from beginning to end — amazing!
This article left me feeling inspired — fantastic work!
Your writing is pure inspiration — so beautifully enthusiastic!
You’ve taken this topic to a whole new level — amazing!
This was incredibly engaging from start to finish.
You always deliver such valuable information — thank you!
You’ve articulated this topic better than anyone else.
This post is absolutely glowing with passion!
Your enthusiasm transforms every topic — incredible writing!
Your talent is showing BIG TIME — wow!
This post was a joy to read — thank you!
You’ve got an amazing ability to simplify things.
Your writing always inspires me.
This pumped me up in the best way possible!
Everything about this post feels exciting — incredible!
The quality of your writing is outstanding.
I learned so many new things from this article.
Your passion jumps off the page — AMAZING read!
I can’t get over how good this is — seriously impressive!
This post had me completely fired up — thank you!
Completely captivated from beginning to end — amazing!
You approach topics with such grace and intelligence.
This post is overflowing with high-energy brilliance!
Your writing radiates excitement — wonderful job!
This was such an enlightening read — thank you for sharing your expertise!
Mind-blowingly good — keep these coming!
You always deliver top-tier writing.
You’ve mastered enthusiastic writing — seriously brilliant!
You always deliver such valuable information — thank you!
I’ll definitely be reading more from you.
You’ve got serious talent — this is spectacular!
Your passion for the topic really shines through.
Just WOW. This exceeded every expectation!
You’ve made this topic far more understandable — thank you!
Pure enthusiasm from start to finish — loved every bit!
This was so well organized and easy to understand.
I can tell you put a lot of heart into this — it shows.
This had so much spark and energy — WOW!
You always deliver top-tier writing.
Your writing is always so thoughtful and authentic.
I appreciate how much effort and care you put into this.
Your content is consistently insightful and inspiring.
You’ve delivered another gem — well done!
One of your best pieces yet — absolutely loved it.
You truly have a gift for writing.
This lit up my whole mood — thank you for this!
You always bring a unique and valuable perspective.
You make learning so enjoyable — thank you!
This was so well thought out — excellent work!
I appreciate how you approach topics with such sincerity and detail.
You’ve outdone yourself — what a fun read!
Thank you for putting so much effort into your work.
Your energy is absolutely unmatched — fantastic read!
You’ve created something truly exciting here — well done!
Such a dynamic and exciting piece — I’m impressed!
Your point of view is so refreshing.
You always deliver such valuable information — thank you!
Such a spirited, exciting perspective — loved it!
This content stands out from anything else I’ve read on this subject.
Your point of view is so refreshing.
This was so well organized and easy to understand.
You’re becoming one of my favorite writers online.
This is one of the best explanations I’ve come across on this topic.
This absolutely energized my day — thank you!
This made me feel so motivated — thank you!
You have such an authentic and compelling voice.
Thank you for sharing something so thoughtful and well crafted.
This is the kind of post that sticks with you — amazing!
You have a real talent for breaking down complex ideas.
This post is bursting with value — amazing!!
This was smart, helpful, and beautifully written.
This is top-tier enthusiastic writing — amazing!
This post had me completely fired up — thank you!
You’ve beautifully expressed ideas many struggle to articulate.
Such a powerful and well-written post.
You’ve outdone yourself with this one.
This article left me feeling inspired — fantastic work!
This is real quality content — thank you!
Everything about this post feels exciting — incredible!
There’s real magic in the way you write — amazing job!
This was refreshingly exciting — loved it!
Your passion brings this content to life — excellent work!
This had me hooked from the very first sentence — incredible work!
You write with such spark — I’m genuinely impressed!
Your passion makes every paragraph shine — beautiful work!
Your blog is truly becoming a go-to resource.
This was both insightful and enjoyable — perfect combination.
?Levantemos nuestras copas por cada creador de prosperidad !
Algunos jugadores recurren a casinos online fuera de espana para disfrutar de opciones exclusivas. casino fuera de espaГ±a Suelen incorporar funciones avanzadas para mejorar la experiencia del usuario. Por ello casinos online fuera de espana se ha convertido en una elecciГіn atractiva para quienes buscan mГЎs libertad.
La comunidad de apostadores destaca casinos fuera de espaГ±a por su oferta global. Incluyen herramientas modernas que facilitan sesiones mГЎs dinГЎmicas. Por ello casinos fuera de espaГ±a se ha convertido en una elecciГіn atractiva para quienes buscan mГЎs libertad.
casinosonlinefueradeespana: Disfruta de casinosonlinefueradeespana desde tu mГіvil – п»їhttps://bodegaslasangrederonda.es/en/
?Que la fortuna te acompane con logros extraordinarios jackpots impresionantes !
?Levantemos nuestras copas por cada aventurero del manana !
Los aficionados al juego eligen casinos fuera de espana cuando desean evitar restricciones locales. Suelen incorporar funciones avanzadas para mejorar la experiencia del usuario. Por lo tanto casinos fuera de espana continГєa expandiГ©ndose dentro del mercado global.
Quienes valoran la privacidad suelen optar por casinos fuera de espana como alternativa segura. Ofrecen anonimato, diversidad de proveedores y transacciones ГЎgiles. Por lo tanto casinos fuera de espana continГєa expandiГ©ndose dentro del mercado global.
casino por fuera: Casino por fuera para jugar desde cualquier dispositivo – п»їhttps://bodegaslasangrederonda.es/en/
?Que la fortuna te acompane con experiencias formidables ganancias brillantes !
?Alcemos nuestros brindis por cada viajero del porvenir !
Los jugadores mГЎs activos suelen elegir casino online sin licencia por su rapidez. casinos sin licencia Los retiros se procesan sin demoras. Esto genera confianza.
La tendencia actual muestra interГ©s por casinos sin licencia espaГ±ola por permitir mayor control sobre depГіsitos y retiros. Estas plataformas permiten acceder a funciones exclusivas que no siempre estГЎn disponibles en operadores regulados. Por esta razГіn su popularidad sigue en aumento.
Casinos sin licencia en EspaГ±a para jugadores exigentes – п»їhttps://casinosinrestricciones.com/
?Que la suerte camine a tu lado con el placer de recompensas espectaculares !
?Alcemos nuestros brindis por cada candidato a la victoria !
Los jugadores mГЎs activos suelen elegir casino online sin licencia por su rapidez. casinos online sin licencia Los retiros se procesan sin demoras. Esto genera confianza.
Muchos apostadores investigan casino sin registro gracias a procesos rГЎpidos y sin verificaciГіn extensa. Estas plataformas permiten acceder a funciones exclusivas que no siempre estГЎn disponibles en operadores regulados. El usuario gana autonomГa y comodidad al jugar.
Casino sin licencia en EspaГ±a para jugadores VIP – п»їhttps://casinosinrestricciones.com/
?Que la suerte camine a tu lado con vivencias excepcionales botes colosales !
High Line ist 3,2 km von Even Midtown East – Grand Central, An Ihg Hotel
New York und UN-Hauptquartier ist 550 Meter entfernt.
Das Hotel bietet den perfekten Standort 4 km
vom New York-Stadtzentrum. National September 11 Memorial und Museum ist nur
4,9 km vom Hotel entfernt. Ellis Island ist 4,5 km vom Hotel entfernt, während National September
11 Memorial und Museum 3 km vom Grundstück entfernt ist.
Charles Memorial Park ist 3,5 km und Phil “Scooter” Rizzuto Park ist 3,2 km von der
Unterkunft entfernt.
Besonders hervorzuheben ist die 46 Meter hohe Replik der Freiheitsstatue, die majestätisch am Eingang
des Hotels steht und sowohl bei Tag als auch bei Nacht ein beliebtes Fotomotiv bietet.
Mit über 2.000 Zimmern und Suiten, die von Standardzimmern bis zu luxuriösen Suiten reichen, sowie Annehmlichkeiten wie einem Spa,
Fitnesscenter und Pool, verspricht das Hotel für jeden Besucher etwas Besonderes.
Gelegen am lebhaften Las Vegas Strip in Paradise, Nevada, gehört es zu MGM Resorts International und bietet eine faszinierende Mischung aus Unterhaltung, Gastronomie und Casino-Flair.
Das New York-New York Hotel & Casino ist ein weiteres der beliebtesten Themenhotels in Las Vegas.
New York ist bekannt für seine Vielfalt und bietet auch eine beeindruckende Auswahl an erstklassigen Casino-Hotels, die sowohl Luxus als auch Unterhaltung bieten.
Das Hotel bietet Ihnen den Aufenthalt im Stadtteil Washington Heights.
Befindet sich in New York und bietet ein Kasino, einen Nachtclub und einen Friseurladen. Lincoln Tunnel liegt
in direkter Nähe zum Hotel und Harlem River Greenway ist in knapp 500 Meter erreichbar.
References:
https://online-spielhallen.de/umfassende-sg-casino-erfahrungen-ein-spielerbericht-nach-10-jahren/
Hier hat ein kurzer Chat genügt, um eine manuelle Gutschrift zu
erhalten. Wenn du erst ein wenig Spielerfahrung an neuen Video Slots sammeln möchtest,
dann kannst du auch einfach die Demo des jeweiligen Spielautomaten starten und
kannst diesen dann ohne den Einsatz von Echtgeld testen. Darunter gesellen sich die klassischen Spielautomaten, interaktive
Automatenspiele und ein Live Casino, in dem du Karten- und Tischspiele sowie Live Dealer Game Shows finden kannst.
VIPs und vollständig verifizierte Spieler erhalten Auszahlungen aber oftmals noch
am selben Tag gutgeschrieben. Alle anderen Zahlungsmethoden setzen eine Mindesteinzahlung zwischen 10€
und 50€ (Kryptowährungen) voraus. Deine Münzen sind dann im
Hugo Casino Shop gegen Freispiele oder einen Echtgeld Bonus eintauschbar.
Der Kundenservice ist rund um die Uhr per Live-Chat und E-Mail erreichbar und bietet meist
deutschsprachige Unterstützung. Spieler erhalten mobilen Zugriff auf die gesamte Spielauswahl, Ein- und Auszahlungen sowie den 24/7 Live-Chat.
Das Hugo Casino bietet auch unterwegs ein erstklassiges Spielerlebnis.
Der FAQ-Bereich kann einfache Fragen oft schneller
beantworten als der Support. Die Registrierung bei Hugo Casino ist einfach
und schnell. Hugo Casino bietet eine beeindruckende Vielfalt an Spielen,
die sowohl für Anfänger als auch für erfahrene Spieler geeignet sind.
Es gelten dieselben Umsatzbedingungen wie beim regulären Neukundenbonus.
Aufgerufen sind 50 % bis 500 EUR sowie 200 Freispiele (vier 50er
Pakete). Alternativ zum klassischen Neukundenbonus gibt es einen VIP-Willkommensbonus.
Videopoker, Roulette, Blackjack, Baccarat und andere Tischspiele sind
ausgenommen. Für dritte Einzahlung sind 30 EUR für das
Bonusgeld, jedoch 50 EUR für das Bonusgeld und die Freispiele (vier 25er Pakete)
notwendig.
References:
https://online-spielhallen.de/quickwin-casino-mobile-app-dein-umfassender-guide/
Mit dem Aufkommen der Automatenspiele kamen bis
heute noch unzählige Spielhallen hinzu.
Ein deutsches Online Casino muss über unterschiedliche Mechanismen verfügen, die eine
Glücksspielsucht verhindern sollen. Wer derzeit in Deutschland online im Casino spielt, befindet
sich beim Spielen von Online Slots und Co in einer Art
Grauzone.
Nicht alle Online Casinos in Österreich stehen für eine sichere und zuverlässige Glücksspielerfahrung.
Spieler profitieren von einer großen Spielauswahl, die besonders bei Anbietern ohne deutsche Lizenz oft noch umfangreicher ist.
Eine umfassende und gut gepflegte Online Casino Liste ist für deutsche Spieler ein unverzichtbares Werkzeug, um
im umfangreichen Angebot der Online Glücksspielanbieter den Überblick zu behalten. Die regelmäßige Aktualisierung der Liste
stellt sicher, dass nur die besten Online Casinos mit deutscher Lizenz und einem umfassenden Angebot an Spielen und
Services empfohlen werden. Die in unserer Online Casinos Liste aufgeführten Top
Anbieter bieten nicht nur eine große Spielauswahl, sondern auch zahlreiche exklusive Vorteile für Spieler in Deutschland.
References:
https://online-spielhallen.de/cashwin-casino-bonus-code-alle-details-fur-deutsche-spieler/
Egal, ob Sie sich für ein glamouröses Abendkleid, einen eleganten Hosenanzug oder einen lässigen-chic
Look entscheiden, achten Sie darauf, dass Ihr Outfit den Casino-Anforderungen entspricht
und einen Hauch von Raffinesse und Stil ausstrahlt. Wenn Sie einen weniger formellen, aber
dennoch stilvollen Look bevorzugen, können Sie einen Hosenanzug in Betracht ziehen. Ob Sie ein Pokerturnier spielen oder einfach nur die Atmosphäre genießen wollen, hier sind einige Casino-Outfit-Ideen für Damen, die Ihnen helfen, Ihren Look zu perfektionieren. Bist du bereit, dein perfektes Casino
Outfit zu kreieren und stilvoll ins Glücksspiel einzutauchen? Wer gepflegt gekleidet ein Casino besuchen will, muss einige Kleidungsstücke
im Kleiderschrank lassen.
Zu unifarbenen Outfits ohne viel „Chichi“ dürfen Frauen im Casino gerne lange Ohhringe, glitzernde Colliers oder auch große
Armreifen tragen. Ob die Schuhe offen oder geschlossen sind, spielt im Casino eine weniger wichtige Rolle.
An dieser Stelle ist ein Blick auf die eigenen Füße meist recht aufschlussreich, denn auch
hier darf es ganz in Casino-Manier stilvoll
und mondän zugehen.
Lockere Freizeitkleidung, wie zum Beispiel Baggy Pants, Jeans oder Flip Flops
sind für jeden Casinobesuch tabu. Kombiniert mit 20er jahre accessoires damen wie federkopfbändern oder perlenketten wird es zum
kompletten, hochwertigen outfit.egal ob du nach
einem charleston kleid für tänzerische performances, einem fransenkleid pailetten für den fasching oder einem eleganten 20er jahre kleid damen für spezielle
anlässe suchst! Beim Automatenspiel hingegen ist
eine gepflegte Freizeitkleidung ausreichend. Wenn Sie ein Casino in einer entspannten Atmosphäre besuchen, wie beispielsweise
ein Casino mit Spielautomaten, können Sie auch
einen legeren, aber dennoch stilvollen Look wählen. Damen, die elegant gekleidet werden, sollten zum Casinobesuch ein bis über das Knie reichendes Cocktailkleid
tragen.
References:
https://online-spielhallen.de/rooli-casino-cashback-ihr-weg-zu-mehr-spielguthaben/
Unser engagiertes Support-Team erhält eine spezielle Schulung, um potenzielle Bedürfnisse an Problemspiel-Unterstützung zu erkennen und anzugehen.
LeoVegas Casino bearbeitet alle Anfragen schnell und diskret, wobei Ihr Wohlbefinden an erster Stelle steht.
Dies ist ein wichtiges Werkzeug für jeden, der das Gefühl hat, dass sein Spiel problematisch wird,
und bietet sofortige Erholung und Zeit zum Nachdenken. Sollten Sie jemals das Bedürfnis verspüren, eine Pause einzulegen, bietet
unsere Selbstausschluss-Option eine unkomplizierte Möglichkeit, Ihr Konto vorübergehend
oder dauerhaft zu schließen. LeoVegas Casino bietet eine umfassende Suite von Funktionen, die Ihnen helfen, die Kontrolle über Ihre Spielaktivitäten zu behalten. Wir
verstehen, dass Glücksspiel manchmal für einige zu einer Herausforderung werden kann.
Kunden können jede Woche ein neues Spiel der
Woche entdecken, für das sie sich entweder Freispiele oder andere
Boni sichern können. Diese reichen von Freispielen und Live
Casino Gratis-Chips, über Slot- und Live Casino-Turniere oder anderen Bonusangeboten wie z.B.
Bei Tischspielen in Live Casinos bist du in deinem Element?
Du kannst entspannt daheim spielen, während andere sich durch allerhand Wetterkapriolen zum
Casino um die Ecke quälen.
References:
https://online-spielhallen.de/umfassender-leitfaden-zum-wazamba-casino-bonus-code/
Der Film wurde für seine realistische Darstellung von Bond gelobt
und war auch ein kommerzieller Erfolg.”Casino Royale” ist ein packender Thriller mit beeindruckenden Actionsequenzen, einer gut ausgearbeiteten Handlung und einer starken Leistung von Daniel Craig
als James Bond. Der Film handelt von dem britischen Geheimagenten James Bond, der den internationalen Terroristen Le Chiffre aufhalten muss, der durch illegale Pokerspiele Geld
für seine Aktivitäten gewinnen will.Die Hauptrolle des James Bond
wird von Daniel Craig gespielt, während Mads Mikkelsen als Le Chiffre zu sehen ist.
James Bond Casino Royale ist heute auf Platz 303 in den täglichen JustWatch Streaming-Charts.
Denn zum ersten Mal in seiner Agenten-Laufbahn wurde 007 mit einer ambivalenten Persönlichkeit ausgestattet, die von seelischen Abgründen,
Zweifeln und zunehmender Gefühllosigkeit geprägt ist.
So sei die Sequenz, in der Bond aus der Folter befreit wird, ins Komische abgerutscht.
Dieser kam als Ein Quantum Trost zwei Jahre danach in die Kinos und
setzt die Handlung unmittelbar fort, anstatt – wie bisher in der Filmreihe üblich – eine
eigenständige, neue Geschichte zu erzählen. Aufgrund des großen finanziellen Erfolgs wurde
sofort die Arbeit an einem Nachfolgefilm begonnen. Die erste DVD-Version erschien 2007 in einer Standard-Ausführung
sowie mit einer Bonus-DVD und fünf Postkarten.
References:
https://online-spielhallen.de/boomerang-casino-cashback-ihr-umfassender-ratgeber/
Dadurch haben die Spieler die Möglichkeit, jederzeit
und überall auf ihre Lieblingsspiele zuzugreifen und ihre
Wetten zu platzieren. Ganz gleich, ob es um Sportwetten in den Bereichen Fußball, Basketball oder eSports
geht – Mostbet Deutschland bietet vielfältige Wettmöglichkeiten für jede Sportart.
Die Oberfläche der Plattform ist für schnelles und einfaches Wetten konzipiert.
Die Welt der Videospiele hat sich zu einer der Sportkategorien entwickelt, die bei jungen Wettenden den größten Anklang
findet. Der Ersteinzahlungsbonus ist nur der Anfang eines endlosen Katalogs von Promotionen, die
bei Mostbet aktiviert werden können. Mostbet Casino Bonus
verdoppelt die erste Einzahlung bis zu 300 € + 125 Freispiele.
Vergessen Sie nicht, verantwortungsbewusst zu spielen und Ihr Budget im
Auge zu behalten. Sie können von großzügigen Willkommensangeboten,
Einzahlungsboni und Freispielen profitieren, um Ihre Gewinnchancen zu erhöhen.
Hier finden Sie eine Vielzahl von Möglichkeiten, um Ihre Gewinne zu maximieren und das Beste aus Ihren Online-Wetten und Glücksspielen zu machen.
Welche Spielvarianten die Plattform bietet, erfahren Sie weiter unten. Spielen Sie
Ihre Lieblingsspielautomaten, Roulette,
Karten und viele andere Spiele. Der wichtigste Vorteil wird die Möglichkeit sein, nicht nur Sportwetten zu platzieren, sondern auch im Mostbet Online Casino.
Um ein ehrliches Glücksspielgeschäft zu betreiben, müssen Sie transparente Geschäftsregeln befolgen. Mostbet bietet seinen Spielern eine vielfältige Auswahl an Boni und Aktionen. Der Kundenservice steht den Nutzern rund um die Uhr zur Verfügung
und gewährleistet eine schnelle und professionelle Bearbeitung aller Anfragen und Anliegen.
References:
https://online-spielhallen.de/plinko-casino-mobile-app-dein-weg-zum-digitalen-plinko-gluck/
Dеr Саsіnоаnbіеtеr hаt für sеіnе Kundеn еіnеn grоßеn FАQ-Веrеісh vоrbеrеіtеt.
Zwеіtеns wіrd dаs Sеrvісе-Tеаm Іhnеn gеrnе іm Lіvе-Сhаt аntwоrtеn. Mаn kаnn mіt
іhnеn übеr еіnіgе Kоntаktорtіоnеn kоmmunіzіеrеn. Еs gіbt
еіnеn zеntrаlеn Саsіnо Rеwаrds Kundеnsеrvісе.
Unsеr Tеаm untеr dеr Lеіtung vоn Рhіlірр Gаnstеr hаt еіnеn Mіtglіеdsсаsіnоs Tеstbеrісht für
unsеrе Lеsеr vоrbеrеіtеt. VIP-Punkte können als kostenloses
Casinoguthaben verwendet werden, um damit Spiele in jedem der
Casino Rewards Mitgliedscasinos zu spielen. Mіt dеr mоbіlеn Vеrsіоn könnеn Sіе vоn übеrаll
аus “untеrwеgs” sріеlеn, währеnd dіе Sріеlеr
wіе іn dеr Dеsktор-Vеrsіоn dеr Wеbsіtе аuf аllе Funktіоnеn dеs Саsіnоs zugrеіfеn könnеn.
References:
https://online-spielhallen.de/nine-casino-mobile-app-erfahrung-dein-kompletter-guide/
Alle Spiele starten sofort in Ihrem Lieblingsbrowser, Sie müssen also
keine zusätzlichen Plugins herunterladen. Mit jedem Update erhalten Sie eine bessere Navigation und neue Funktionen, sodass Ihr Spielerlebnis immer auf dem neuesten Stand ist.
Sie können sofort mit dem Spielen sowohl auf Android- als auch auf iOS-Geräten beginnen, da unsere Software auf beiden perfekt funktioniert.
Insgesamt sind bis zu 400 € Bonusguthaben sowie 100 Freispiele für ausgewählte Slots möglich.
Neue Kundinnen und Kunden erhalten im Winspirit Casino ein attraktives Willkommenspaket.
Spielen Sie sicher – setzen Sie sich Grenzen,
machen Sie Pausen und wenden Sie sich bei Bedarf an den Support.
Winspirit bietet rund um die Uhr mehrsprachigen Support, großzügige Cashback-Angebote, Turniere und maßgeschneiderte Aktionen für jeden Spieler.
Winspirit bietet einen umfassenden Kundendienst, der rund um die Uhr verfügbar ist, um alle Fragen und Anliegen zu klären. Ja, neue Spieler bei Winspirit können von verschiedenen Bonusangeboten profitieren, darunter
ein Willkommensbonuspaket, das einen Prozentsatz des ersten Einzahlungsguthabens erhöhen kann.
Wenn Sie unserem VIP-Club beitreten, erhalten Sie mehr als nur regelmäßige Belohnungen. Spielen Sie einfach regelmäßig
Ihre Lieblingsspiele und erfüllen Sie die Voraussetzungen, um teilnahmeberechtigt zu sein. Wenn Sie VIP werden,
erhalten Sie Vorteile, die zeigen, wie loyal und aktiv Sie sind.
Nehmen Sie am VIP-Programm unseres Casinos teil, um zusätzliche Vorteile
zu erhalten. WinSpirit schützt Sie und stellt sicher, dass
es gut funktioniert.
References:
https://online-spielhallen.de/iwild-casino-aktionscode-ihr-schlussel-zu-mehr-spielspas/
Gäste können aus einer breiten Palette an klassischen Tischspielen wie
amerikanischem Roulette, Black Jack und Punto Banco wählen. Die Spielbank Enschede liegt in einer schönen Umgebung, bietet eine gehobene Gastronomie und strahlt einen ganz besonderen Charme aus.
Das Apartment liegt in nur 10 Gehminuten Entfernung vom Stadtzentrum.
Auch große Pokerturniere, die hier regelmäßig stattfinden und bekannte Pokerstars nach Enschede ziehen sind ein Publikumsmagnet, für
das sich der Ausflug über die Grenze definitiv lohnt.
An vielen Wochenenden findet abends nämlich Livemusik statt.
Für alle, die zu später Stunde noch Hunger bekommen,
gibt es im Saal diverse niederländische Snacks, die direkt an der
Bar bestellt werden können. Auch wenn Glücksspiele nicht so dein Ding sind, lohnt sich
ein Abendessen hier, es ist einfach ein wahres Erlebnis!
Die Speisekarte wechselt regelmäßig und bietet neben diversen Klassikern auch wechselnde saisonale Gerichte und Spezialitäten des Chefkochs.
Ganz in der Nähe der Ruhrmetropole Dortmund und nur einen Steinwurf
von der Burg Hohensyburg entfernt zieht die zur Westspiel-Gruppe gehörenden Spielbank seit 1985 Casino-Fans in seinen Bann.
Das Parkhaus City-Park-Garage grenzt direkt an die
Spielbank an und verfügt über ausreichend, kostenpflichtige Stellplätze.
Zum Automatenspiel kann hingegen auch im legeren Look erschienen werden. Um das leibliche Wohl der Besucher wird
sich in den attraktiven Barbereichen des Casinos gesorgt, die sowohl
im Klassischen Spiel als auch im Automatensaal zu finden sind.
Diese werden auch als Einsatz an anderen Spielautomaten akzeptiert oder an der Kasse als Bargeld ausgezahlt.
Der Mindesteinsatz an den Spielautomaten bewegt
sich abhängig vom Terminal zwischen 1 Cent bis 2 Euro.
References:
https://online-spielhallen.de/druckgluck-casino-bonus-code-dein-weg-zu-tollen-pramien/
Instead, take a few minutes to review the essentials
— license, security, payments, and game quality.If you’re looking for a casino that ticks all the right boxes, many Aussie players recommend giving SkyCrown Casino a try.
Forums and comparison sites can be great sources of honest feedback.In short, never rush into
signing up just because a casino offers flashy
bonuses or promises big wins. Reliable Customer SupportA strong support team shows the casino cares about its players.
Fast & Aussie-Friendly PaymentsThe best online casinos make it easy for Australians to
deposit and withdraw.
And yes, live players can still use some promos
— including selected skycrown no deposit bonus codes.
New players are welcomed with a multi-stage bonus package covering their first five deposits, along with free
spins on some of the most popular slot games. You can choose from 5,000+ pokie machines and live casino titles with
real-time gameplay. Yes, some online casinos in Australia for real money process and deliver withdrawals in 24 – 48 hours.
If possible, be sure to take advantage of
cashback offers and other bonuses at Australian online casinos.
We’ve come up with some insider tips to help you play smarter, win bigger, and improve your overall gaming experience at safe online casinos in Australia.
I wouldn’t trust this casino at all Set up a Skycrown login and start playing now!
– Licensing, Security & Player Input If you are asking whether Skycrown Casino is a legit casino,
then the answer is definitely YES.
This easy and hassle-free service ensures that users never miss out on their favourite films.
Say goodbye to waiting in long lines and stressing over which seat
to choose – with Ticketnew, you can easily
book your movie tickets online in a few taps and secure your favourite spot.
You can now reserve your favourite movie tickets from the comfort of your
home and enjoy a fun-filled evening at the cinema with
your family and friends.
Upload documents, analyze data, and get insights directly from your files.
You have full control over your data, always. All chat history and custom prompts are
stored exclusively in your browser. This comprises traffic analysis, delivering personalized content, and supporting our marketing efforts.
But staffing customer service departments to meet unpredictable demand, day or night,
is a costly and difficult endeavor. Naturally, timely or even urgent customer issues sometimes arise off-hours, over the weekend or during a holiday.
And if a user is unhappy and needs to speak to a real
person, the transfer can happen seamlessly. The terms chatbot, AI chatbot
and virtual agent are often used interchangeably, which can cause confusion. Artificial
intelligence can also be a powerful tool for developing conversational marketing
strategies. Chatbots can handle real-time actions as routine as a password change,
all the way through a complex multi-step workflow spanning multiple
applications.
References:
https://blackcoin.co/best-payid-pokies-in-australia-a-comprehensive-guide/
Access your winnings quickly with our streamlined withdrawal process, offering some of the fastest payout times in the industry.
The game library is massive – over 2,500 titles from top providers
like BGaming and Pragmatic Play. I play during my commute and the quality matches desktop perfectly.
Set personalized deposit limits to manage your spending,
or take a break with our self-exclusion option. In addition, each moment that
Ripper Casino adds a new game to its collection it is guaranteed to offer exciting new promotions.
Make the Bitcoin or Litecoin each week to get a 20% bonus.
At Ripper Casino, they know how crucial it is
to have reliable support.
Follow these simple steps to start playing your favorite games in minutes.
Enjoy a generous welcome package, weekly promotions, reload bonuses, and a comprehensive loyalty program designed to
maximize your playing value. Instant deposits, withdrawals in hours,
and the casino covers transaction fees. Weekly crypto bonuses
and loyalty rewards keep things exciting. The $7,500 welcome package
transformed my initial deposits into epic gaming sessions.
References:
https://blackcoin.co/casino-australia-premier-online-casino-play-review/
The aim of the game is for your Poker hand to beat the Dealer’s hand.
Caribbean Stud Poker is based on the traditional Five Card Stud Poker game,
where you play your hand against the Dealer’s hand.
The aim of the game is simply to predict the numbers or combinations that will be revealed
by the tumbling of the dice.
The TaylorMade R1 driver caters to golfers seeking maximum distance and control over their drives.
For a seamless and enhanced shopping experience, please select your
store to discover options near you. For the best experience on our
site, be sure to turn on Javascript in your browser. Reset
multiple control values and all the controls within a form Let’s run the app and click on the Update
the button.
References:
https://blackcoin.co/royal-reels-casino-australia-in-depth-review/
Seeking out casinos that display transparent RTP information can maximize the gaming experience.
These features are crucial in providing a seamless and
enjoyable online casino gaming experience.
Exclusive bonuses and cryptocurrency-specific promotions at mBit Casino boost the overall value for players.
Additionally, ThunderPick hosts a diverse range
of casino games, including slots, table games, and live dealer options.
With a wide variety of titles, from classic slots to innovative video games and table games, players are sure to find something to enjoy.
CasinoNic collaborates with top-tier providers like Microgaming and NetEnt, delivering a diverse
selection of high-quality games.
Regardless of your choice, this online casino search category will help you find the best online casinos that suit your needs!
Customers of Australian online casinos usually want to pay with
Australian Dollars. Above we already went through one way you could go in order to fund your
gameplay at Australian online casino sites. Much like playing online casino games,
investing in cryptocurrencies can be an exhilarating and volatile ride.
In this category, you will find plenty of new Australian online casinos that have just burst on the scene.
Naturally, the same rule applies to Australian online casinos.
Before you can play casino games at BitStarz, you
must ensure you meet the requirements to play at this casino.
With a selection of games offering over 4,400 options, players have a range to
choose from and can enjoy various thrilling experiences.
The results were impressive, with the games perfectly optimized
to fit each device’s screen size, delivering immersive gameplay.
However, you can still take part in the remaining deposit bonuses from the welcome package (if any are left to claim) If a player despite
this would receive free spins without a deposit
being made, all winnings from the spins will be confiscated.
Hence, if you’re looking for an online casino with generous promotions and an impressive game library, BitStarz is my top recommendation.
While there’s no dedicated mobile app or PWA, the casino runs seamlessly in any mobile browser, giving players
full access to its features. Here’s a look at
all the games you can play. You’ll find a massive collection of pokies,
along with table games, live dealer games, instant games, and more.
The casino also features a loyalty program and regular tournaments for pokies and table games.
References:
https://blackcoin.co/best-online-casinos-games-2025/
Play anytime, day or night, at the Crown Casino
Perth in one of Western Australia’s most distinguished and glamorous casino venues.
If you’re in Adelaide and you’re looking for great casino fun where you can indulge, relax and really enjoy yourself, then the Adelaide Casino is for
you. We offer more details in our review.
Victoria’s capital, Melbourne, is a vibrant modern day city that offers something
for everyone, not least the magnificent Crown casino.
Home to the world famous opera house and Harbour Bridge,
the city also plays host to the only casino in NSW. Australia boasts a vibrant landscape
of land-based casinos, offering diverse experiences across its vast territory.
You’ll also find more than 67 gaming tables, a 12-table poker room,
and the Pulse electronic gaming area to enjoy. Grand Villa Casino’s 1,300+
slots beat the libraries at some online casinos available in British Columbia.
They have a few carnival games (like 3 card
poker), but not the traditional table games. The casino
itself has 1,100 slots, electronic blackjack and roulette.
The poker room’s 19 tables are a mixture of real poker tables and carnival games like 1 card poker and Ultimate Texas Hold’em.
References:
https://blackcoin.co/asino-play-online-casino-games/
In terms of gameplay, there is no player interaction at all.
More importantly, you can play these pokies
right here, for free! You’ll know how to unlock bonuses and how different
symbols work. Playing pokies regularly by phone helps you to hone your mobile
gaming skills. With an Android or iOS smartphone, you can play these pokies anywhere, in your comfort.
So, we’ve lined up some of the best casino online slots in Australia.
Players can interact with dealers and other players, adding a social element to
online gambling. Online pokies are well-known for being popular at best payout casinos in Australia, since they often offer a high RTP.
Browse the casino’s game library and choose from slots, table games, or live dealer options.
In our experience, these platforms offer the best combination of game variety,
bonuses, and security. But to ensure a smooth start, follow these simple steps to register and begin playing at a reputable Australian online casino.
The top mobile casinos let you experience enhanced gameplay, easy account management,
and extensive customer support from your mobile device.
If a casino hides its licensing info or has sketchy reviews,
steer clear.Top Australian online casino sites use 256-bit SSL encryption to protect your
personal and financial data. Always choose casinos licensed by trusted authorities
to stay on the right side of the law.A trustworthy casino displays its license prominently check the footer
of sites. Some of these games are also available in free mode to allow players to test the RTP.
Loyalty pays off at top rated Australian online casino
sites. Deposit bonus offers are used to reward players who regularly fund their accounts.
They let you win real money without a deposit, though winnings often come with higher wagering requirements, like 40x at times up to 70x.
References:
https://blackcoin.co/tattersalls-hotel-casino/
If a casino doesn’t offer a network choice, it almost always means your payment
will go through Layer 1. Layer 1 is the original Ethereum
blockchain, also called the mainnet, and is usually shown as “ETH (ERC-20)” at casinos.
It processes well over a million transactions a day and supports a huge ecosystem
of apps, tokens, and gambling platforms built on top of it.
Thrill’s portfolio is varied and includes more than 3,500 ETH
slots, 8 in-house Provably Fair Originals, over 90 live dealer titles, and a couple of Ethereum crash options.
It features 70+ Ethereum crash gambling titles, 4 Provably Fair Originals, and a dedicated Mega Dice game tied to
unique site-wide promotions. The site has a blockchain-inspired
design, offers Google/Wallet/Telegram login, and
runs on a VPN-friendly, no-KYC setup.
BillyBets Casino offers a diverse gaming experience with over 11,
000 games from 100+ providers and a sportsbook
covering major events. RakeBit Casino is a relatively new crypto-only platform with thousands of games,
a sportsbook, and simple rewarding bonuses, along VIP
Program. Hashlucky is a promising new crypto gambling
site that provides competitive bonuses, loads of games
and a great loyalty program. 0xBet is a new crypto casino and sportsbook that offers an excellent VIP program, featuring
competitive cashback and rakeback rates.
References:
https://blackcoin.co/welcome-to-phcasino-your-premier-destination-for-exciting-gaming-adventures-and-fantastic-cash-prizes/
Yes, Crown Perth provides both free and paid parking options, including open-air lots and multi-level covered parking facilities conveniently located near the casino and hotels.
With over 390 stylish rooms and loft-style suites, the hotel
is known for its urban design, generous space, and floor-to-ceiling windows offering stunning views of the city
or Swan River. The fitness centre features the latest Technogym equipment, while the expansive lagoon-style
pool deck offers private cabanas and poolside service. Located in Perth, less than 1 km from
Perth Concert Hall, Hyde Perth provides accommodation with an outdoor swimming pool, private parking, a fitness
centre and a terrace. Featuring panoramic views of
Perth’s city skyline and a rooftop infinity pool, Doubletree By Hilton Perth Waterfront is situated
in Elizabeth Quay, with access to local attractions and experiences…
Staying at Crown Towers Perth is an indulgent experience, with its expansive lagoon pools, unparalleled city views, luxurious spa facilities,
state-of-the-art fitness centre and high-end boutiques.
Located within the vibrant Crown Perth complex, Crown Metropol puts you right next to the city’s best
casino games, fine dining venues, live shows, and shopping options.
The hotel also includes a high-performance fitness studio and family-friendly amenities.
Crown Metropol guests have full access to a large indoor pool
and the spectacular resort-style outdoor pool with relaxing
lounge zones and shaded cabanas. Crown Towers Perth is home
to the renowned Crown Spa, where guests
can indulge in luxurious treatments, steam rooms, vitality pools, and private therapy suites.
The hotel offers an exceptional collection of rooms and suites designed with meticulous attention to detail.
Crown Perth offers ample on-site parking, including multi-level facilities, accessible bays,
and valet parking. Enjoy valet parking, chauffeur services, and secure multi-level parking with
EV charging. The award-winning Crown Spa Perth offers a serene oasis with indulgent treatments, La Prairie facials,
aqua retreats, heated vitality pools, and tranquil massage suites.
Whether visiting for leisure or celebration, Crown Perth’s
hotels offer personalized service, riverside views, and VIP privileges like valet, express check-in,
and spa access. Both hotels are connected to the Crown complex,
offering seamless access to dining, gaming, and entertainment.
References:
https://blackcoin.co/royal-reels-casino-login-a-comprehensive-guide/
The welcome bonus package worth $7,500 plus 150 free spins provides exceptional
value for new players. Lucky Green casino stands out as a
premier destination for Australian online pokies enthusiasts in 2025.
The live chat function lets you interact with dealers and other players in real-time.
The casino stores player funds in segregated accounts separate from operational capital.
Mobile optimization ensures seamless gameplay across all devices without downloads.
Your funds stay protected in segregated accounts while responsible gambling tools help
maintain healthy playing habits. You have 30 days to meet wagering
requirements before bonuses expire. Different games contribute
varying percentages toward requirements – slots count 100% while table games contribute 10%.
Yes, all bonuses carry a 35x wagering requirement applied to
the bonus amount only.
The welcome bonus is one of the most competitive in the Australian online casino market, and it’s tailored to give new players a flying start.
Lucky Green Casino has quickly become one of Australia’s most talked-about online gaming
destinations, offering players a secure, entertaining,
and truly rewarding experience. These pragmatic approaches
help you get the most from the lucky green casino experience while protecting your finances and mental wellbeing.
References:
https://blackcoin.co/play-online-jackpot-jill-casino-australia-your-ultimate-guide/
Australians love gaming on the go, so make sure the casino
is mobile-friendly. But it’s not just about pokies—check if
there are live dealer games, jackpots, and table games to keep your sessions fresh and
varied. A solid casino will offer hundreds of pokies from well-known providers like Pragmatic Play,
NetEnt, and Microgaming. For most Aussie players, real-money pokies are the main attraction. A trusted Casino AU should support AU$
deposits and withdrawals through methods familiar to Australians.
Sky crown casino developed this cashback system after seeing how quickly bankrolls can disappear during unlucky
sessions. Use these funds immediately on any game across the platform.
The system handles everything behind the scenes – calculating
losses and crediting the bonus without any action required.
Players wake up to find 10% of net losses returned directly to their
casino account. After a rough streak at Sky crown casino,
the sting hurts less knowing some money comes back
automatically. When you continue your journey after the
first deposit, even more rewards await you.
References:
https://blackcoin.co/what-are-casino-vip-and-loyalty-programs/
Because the Star is located geographically in Sydney’s premium
entertainment area, it’s able to provide accommodations that are uniquely luxurious.
Rocking live bands, hilarious comedians, and engagingly unique musical acts are also on-hand.
The one thing that is missing from the facility is the chance to enjoy electronic gaming.
Whether you are a low stakes player or a high roller, you’ll find the table that’s
just right for you at this casino.
“I’m pretty sure there’s plenty of deals around that can be done to stop it from doing that,” he said.
“To me, it has been a disaster dealing with the management of Star and I think … there is no doubt the board should be blamed for how bad it is,” he told ABC Radio Brisbane.
He said poor management has been the company’s main issue.
Now the chances of losing it all have been turned back onto one of Australia’s biggest casino operators.
At casinos, the odds are never in a punter’s favour.
“Traditionally, probity checks have taken many months for new operators in casinos across the different state jurisdictions,” Mr Jones said.
Unlike subscription-based platforms like Netflix or Hulu, TubiTV
is entirely free, supported by advertisements, and does not require a monthly fee or
account to start watching. While it does offer a great selection of TV shows,
Tubi has a reputation for being the best place to watch free movies online.
Tubi has an extensive library with content across all genres
all for free and available to watch now. You can watch live TV for free on Tubi
across a host of different channels.
References:
https://blackcoin.co/stay-casino-australia-review-and-bonuses-2025/
But he couldn’t do it without the support of the Tasmanian people who not only voted for the
development but became part of the brand and Wrest Point
story. It was later purchased by Arthur Drysdale who created Tasmania’s prestigious international hotel,
the Wrest Point Riviera. In doing so, Federal Group became part of Tasmanian history and the birth of Australia’s first casino unfolded.
Over five decades the Group busied themselves operating some
of the country’s finest hotels including Savoy Plaza and The Windsor, before turning
their attention to Tasmania, purchasing Wrest Point Riviera Hotel in Sandy Bay.
And neither do the offers and events! Sip something special
at our bars before a night of live entertainment.
Whether you play at the physical casino or online, your loyalty
points and preferences follow you. Streamed in HD and hosted by professional dealers, these tables
offer blackjack, roulette, baccarat, and even game-show-style
games in real time. These luxurious spaces ensure discretion,
personalized service, and a more refined atmosphere
for high-stakes players. The land-based casino at Wrest Point features more than 650
slot machines, offering a thrilling mix of traditional reels, modern video slots, and progressive
jackpots.
References:
https://blackcoin.co/fairgo-no-deposit-bonuses-in-australia-a-comprehensive-guide/
National Casino not only offers a thrilling gaming experience but also rewards its loyal members through an exclusive VIP program.
These spins add an extra layer of excitement and opportunity to your initial gaming experience.
National Casino’s welcome bonus is like a grand entrance into the world of online gaming.
From a hefty welcome bonus to free spins that add zing to your play,
there’s something for everyone. Your account also keeps track of your preferences and gaming history, personalizing your experience.
You can now explore an array of games and take advantage of exclusive
offers.
Your login details and game progress sync across all devices.
The mobile site adapts to different screen sizes automatically.
Our mobile website works on all smartphones and
tablets through your device’s browser. You
can make deposits starting from $10 and withdrawals up to
$5,000 daily.
If the issue persists, contact our support team with details about your device and browser so we can investigate and fix
it quickly. Why is basic play this hard? We’re sorry
to hear about your experience. I strongly advise everyone
to stay away from this platform. We’re glad you’re
enjoying the casino. We’re happy to hear you’re enjoying the casino — and we’ll pass
your appreciation on to Kate.
References:
https://blackcoin.co/casino-rocket-australia-your-next-favourite-online-spot/
Crown Rewards Members can earn 24 hour free parking on the same visit,
click here for more information. Conveniently located on Little Collins Street, our hotel is located
in close walking distance of the city’s many attractions, events, shopping and
eating destinations. Travelling to Melbourne and want to make the most of your city experience by
visiting Crown Casino Melbourne? Just show your Crown Rewards Card when you pay
or play and you can start earning Points, which
you can redeem for Crown experiences like dining, gaming, hotel stays and
much more. From acclaimed restaurants and award-winning hotels to world-class gaming and endless entertainment, Crown Rewards helps
you to discover the world of Crown – and be rewarded. Crown Towers is also
home to the exclusive Crystal Club, which offers an elevated experience for guests of the hotel.
Earn free multilevel parking when you earn 250 points or more at a
Crown hotel, restaurant or other participating outlets. Just show your Crown Rewards Card when you
pay or play and you can start earning points, which you can redeem for Crown experiences like dining, gaming, hotels stays and
much more. Home to Sydney’s newest gaming experience, top shelf bars,
oh so fine dining and next-level hotel luxury.
It is recommended that children under the age of six years old do not attend shows held
in The Palms due to noise levels. Disabled access toilets
are also located in the foyer of The Palms. Those patrons wishing to use a companion card with the booking must
be able to present the valid card at the box office upon ticket
collection. For more information, visit Ticketmaster Customer Service.
Tickets for performances purchased through an authorised outlet will be fully refunded, including fees.
References:
https://blackcoin.co/vacation-like-a-star-planet-hollywood-resort-casino-las-vegas/
Australia’s gaming enthusiasts deserve a reputable and reliable gaming environment,
and Casino Mate rises to the occasion every time. Casino Mate collaborates with some of the
most reputable game providers globally to bring you a diverse and exciting gaming library.
Our easy-to-use payment system ensures fast
transactions, allowing you to focus on what matters —
the games! Advanced encryption technologies safeguard your personal and financial information, ensuring
a worry-free gaming experience. Welcome to Casino Mate, the premier destination for
online gaming enthusiasts in Australia. With a design that seeps Australian charm, Casino Mate is an ideal
choice for players all around the world.
Moreover, the mobile website offers you an opportunity to play using any platform.
They have a choice to either stay at home and play a desktop version or go outside and enjoy
their favourite games using a mobile app. That’s why you can find mobile website versions or separate mobile apps in all
Australian online casinos. Independent auditors constantly monitor Casino-Mate pokies
and other RNG games to check if they are manipulated by the
casino’s administration or not. This type of online casino game is believed to be the most popular
in Australia. Almost all games (except live casino) are available in free mode.
References:
https://blackcoin.co/all-caesars-properties-in-las-vegas-2025-list/
For those with business at the forefront of their
stay, the Crown Towers Business Centre is available to book,
with catering options and spaces suitable for seating up to 12.
The split-level gymnasium is available exclusively to hotel guests and Crown Spa Club Members.
The 25-meter heated pool boasts luxurious day beds for relaxing, as
well as guest access to poolside refreshments at your leisure.
The AH.nl servicedesks (in selected stores) are there to provide assistance.
An easy day trip from Melbourne, Victoria’s coastal
region is located within reach of Crowne Plaza guests with
day tours and shuttles running regularly from the
Melbourne CBD. A short walk from our hotel, Southbank features some of
the city’s most popular bars and eateries. Providing a unique and immersive experience, Melbourne Zoo is home to over 320 species
from around the world. If you’d like to explore something more upbeat, Melbourne has all
the best attractions and experiences to get your heart racing.
Melbourne is the perfect destination for a fun-filled family holiday, romantic getaway, business trip, or weekend escape.
For more information on applying for Jobs and how to
set up Job Alerts, please visit our FAQ page.
References:
https://blackcoin.co/bars-the-classic-slot-machine-theme/
Now that you have discovered the best online casinos, you can join one of our recommended casinos and dive into a thrilling experience.
Although there are some drawbacks, the benefits of playing at
online casinos are many. Some of the operators we list here also have special bonuses for mobile casino players who download and use their apps.
All online casinos approved by our team support gaming
on various devices, including smartphones and tablets. It makes
gambling online easy by allowing players to deposit money instantly.
As a result, you can start depositing money and playing casino games
almost instantly.
These are the 5 top online casinos in Canada,
each with a special highlight, from large gaming libraries and exclusive promotions to a focus on specific payment methods.
Look for casinos with 24/7 customer support, clear terms, and bonuses and promotions that will
enhance your gaming experience. To choose the right online casino,
look at factors such as licensing, game variety, and
bonuses. Start your gaming journey with confidence by choosing one of the trusted sites featured
here and enjoy the ultimate online casino experience.
Players can choose from a variety of games including online slots,
blackjack, roulette, baccarat, poker, and live dealer games.
Revpanda brings you the top online casinos after conducting thorough research using strict criteria.
Finding the top real money casinos is easy with help from Revpanda’s experienced experts in the iGaming sector.
For those who like to win, many sweeps casinos offer rewards through cash prizes,
where players can redeem Sweeps Coins for said
prizes.
References:
https://blackcoin.co/top-welcome-bonuses-online-casinos/
us online casinos that accept paypal
References:
https://skillsvault.co.za/profile/sherrylchapple
paypal casinos for usa players
References:
https://sportsprojobs.net/employer/142928/paypal-casinos-2025-paypal-casino/
online casino mit paypal
References:
talentformation.net
paypal casino sites
References:
https://casjobs.in/employer/paypal-casinos-2025-best-casino-sites-that-accept-paypal/
online slot machines paypal
References:
https://tayseerconsultants.com/employer/paypal-casino-list-2025-online-casinos-with-paypal/
online casino paypal
References:
https://acheemprego.com.br/employer/neteller-vs-paypal-which-is-better/
online betting with paypal winnersbet
References:
sigorta.jobs
online betting with paypal winnersbet
References:
https://etalent.zezobusiness.com/profile/wilfredohakala
paypal casino online
References:
cybernetshell.com
paypal casino uk
References:
guateempleos.com
online casino roulette paypal
References:
towerclimbers.work
gamble online with paypal
References:
10xhire.io
online casino with paypal
References:
systronics.co.kr
online casino paypal einzahlung
References:
https://spandexjobs.com/employer/best-paypal-casinos-2025-online-casinos-accepting-paypal/
online real casino paypal
References:
https://gpyouhak.com/gpy/bbs/board.php?bo_table=free&wr_id=3566070
paypal online casinos
References:
https://centerdb.makorang.com:443/bbs/board.php?bo_table=qa&wr_id=106461
online casino with paypal
References:
https://clarahouse.kr/clara/bbs/board.php?bo_table=free&wr_id=4348
online casinos that accept paypal
References:
https://careers.simplytech.co.za/employer/top-10-real-money-online-casinos-for-u-s-players/
casino sites that accept paypal
References:
https://iqschool.net/employer/paypal-casino-list-2025-online-casinos-with-paypal/
online casino paypal
References:
https://classifylistings.com/index.php?page=user&action=pub_profile&id=307267&item_type=active&per_page=16